In a couple of earlier posts I’ve mentioned how statistical analyses have sometimes been used to demonstrate that results in published analyses are ‘too good to be true’. One of these cases concerned Mendel’s laws of genetic inheritance. Though the laws have subsequently been shown to be unquestionably true, Mendel’s results on pea experiments were insufficiently random to be credible. The evidence strongly suggests that Mendel tweaked his results to fit the laws he believed to be true. He just didn’t understand enough about statistics to realise that the very laws he wanted to establish also implied sizeable random variation around predicted results, and the values he reported were much too close to the predicted values to be plausible.
As discussed in a recent academic article, a similar issue has been discovered in respect of official Chinese figures for organ donation. China has recently come under increasing international pressure to discontinue its practice of using organs of dead prisoners for transplants. One issue was consent – did prisoners consent to the use of their organs before their death? But a more serious issue was with respect to possible corruption and even the possibility that some prisoners were executed specifically to make their organs available.
Anyway, since 2010 China has made efforts to discontinue this practice, replacing it with a national system of voluntary organ donation. Moreover, they announced that from 2015 onwards only hospital-based voluntary organ donations would be used for transplants. And as evidence of the success of this program, two widely available datasets published respectively by the China Organ Transplant Response System (COTRS) and the Red Cross Society of China, show rapid growth in the numbers of voluntary organ donations, which would more than compensate for the cessation of the practice of donations from prisoners.

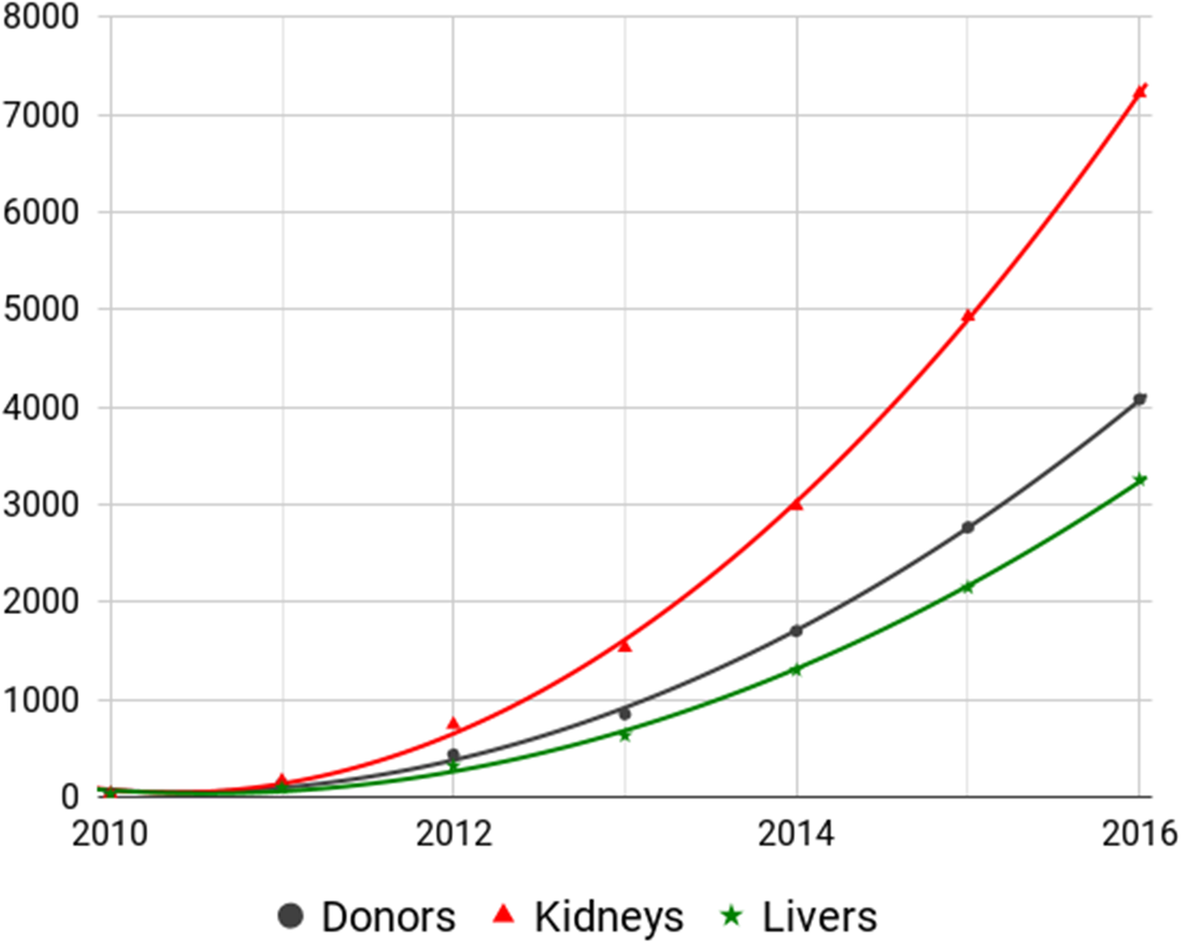
Some of the yearly data counts from the COTRS database are shown in this figure taken from the report references above. The actual data are shown by points (or triangles and crosses); the curves have been artificially added to show the general trend in the observed data. Clearly, for each of the count types, one can observe a rapid growth rate in the number of donations.
But… here’s the thing… look at how closely the smooth curves approximate the data values. The fit is almost perfect for each of the curves. And there’s a similar phenomenon for other data, including the Red Cross data. But when similar relationships are looked at for data from other countries, something different happens: the trend is generally upwards, as in this figure, but the data are much more variable around the trend curve.
In summary, it seems much more likely that the curves have been chosen, and the data chosen subsequently to fit very closely to the curves. But just like Mendel’s pea data, this has been done without a proper awareness that nature is bound to lead to substantial variations around an underlying law. However, unlike Mendel, who presumably just invented numbers to take shortcuts to establish a law that was true, the suspicion remains that neither the data nor the law are valid in the case of the Chinese organ donation numbers.
A small technical point for those of you that might be interested in such things. The quadratic curves in the above plot were fitted in the report by the method of simple least squares, which aims to find the quadratic curve which minimises the overall distance between the points and the curve. As a point of principle, I’d argue this is not very sensible. When the counts are bigger, one would expect to get more variation, so we’d probably want to downweight the value of the variation for large counts, and increase it for the lower counts. In other words, we’d expect the curve to fit better in the early years and worse in the later years, and we should take that into account when fitting the curve. In practice, the variations around the curves are so small, the results obtained by doing things this way are likely to be almost identical. So, it’s just a point of principle more than anything else. But still, in an academic paper which purports to use the best available statistics to discredit the claim made by a national government, it would probably be best to make sure you really are using the most appropriate statistical methods for the analysis.
