Take a look at the following video…
It shows the operation of a mechanical device that is variously known as a bean machine, a quincunx or a Galton board. When the machine is flipped, a large number of small balls or beans fall through a funnel at the top of the device. Below the funnel is a layered grid of pegs. As each bean hits a peg it can fall left or right – with equal probability if the board is carefully made – down to the next layer, where it hits another peg and can again go left or right. This repeats for a number of layers, and the beans are then collected in groups, according to the position they fall in the final layer. At the end you get a kind of physical histogram, where the height of the column of beans corresponds to the frequency with which the beans have fallen in that slot.
Remarkably, every time this experiment is repeated, the pattern of beans at the bottom is pretty much the same: it’s symmetric, high in the middle, low at the edges and has a kind of general bell-shape. In fact, the shape of this histogram will be a good approximation to the well-known normal distribution curve:
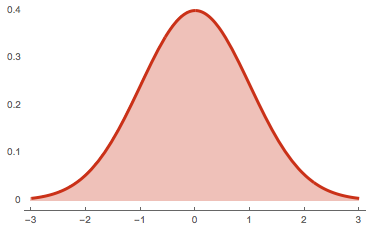
As you probably know, it turns out that the relative frequencies of many naturally occurring phenomena look exactly like this normal curve: heights of plants, people’s IQ, brightness of stars…. and indeed (with some slight imperfections) the differences in team points in sports like basketball.
Anyway, if you look at the bottom of the bean machine at the end of the video, you’ll see that the heights of the columns of beans – which in itself represents the frequency of beans falling in each position – resembles this same bell-shaped curve. And this will happen – with different small irregularities – every time the bean machine is re-started.
Obviously, just replaying the video will always lead to identical results, so you’ll have to take my word for it that the results are similar every time the machine is operated. There are some simulators available, but my feeling is you lose something by not seeing the actual physics of real-world beans falling into place. Take a look here if you’re interested, though I suggest you crank the size and speed buttons up to their maximum values first.
But why should it be that the bean machine, like many naturally occurring phenomena, leads to frequencies that closely match the normal curve?
Well, the final position of each bean is the result of several random steps in which the bean could go left or right. If we count +1 every time the bean goes right and -1 every time the bean goes left, then the final position is the sum of these random +/-1 outcomes. And it turns out, that under fairly general conditions, that whenever you have a process that is the sum of several random experiments, the final distribution is bound to look like this bell-shaped normal curve.
This is a remarkable phenomenon. The trajectory of any individual bean is unpredictable. It could go way to the left, or way to the right, though it’s more likely that it will stay fairly central. Anything is possible, though some outcomes are more likely than others. However, while the trajectory of individual beans is unpredictable, the collective behaviour of several thousand beans is entirely predictable to a very high degree of accuracy: the frequencies within any individual range will match very closely the values predicted by the normal distribution curve. This is really what makes statistics tick. We can predict very well how a population will behave, even if we can’t predict how individuals will behave.
Even more remarkably, if the bean machine has enough layers of pegs, the eventual physical histogram of beans will still look like the normal distribution curve, even if the machine has some sort of bias. For example, suppose the beans were released, but that the machine wasn’t quite vertical, so that the beans had a higher tendency to go left, rather than right, when they hit a peg. In this case, as long as there were sufficiently many layers of pegs, the final spread of beans would still resemble the normal curve, albeit no longer centred at the middle of the board. You can try this in the simulator by moving the left/right button away from 50%.
Technically, the bean machine is a physical illustration of a mathematical result generally termed the Central Limit Theorem. This states that in situations like those illustrated by the bean machine, where a phenomenon can be regarded as a sum of random experiments, then under general conditions the distribution of final results will look very much like the well-known bell-shaped normal curve.
It’s difficult to overstate the importance of this result – which is fundamental to almost all areas of statistical theory and practice – since it lets us handle probabilities in populations, even when we don’t know how individuals behave. And the beauty of the bean machine is that it demonstrates that the Central Limit Theorem is meaningful in the real physical world, and not just a mathematical artefact.
Can’t live without your own desktop bean machine? I have good news for you…