Not content with having recently won the London marathon for the fourth time in a record time of 2:02:37, the phenomenal Kenyan athlete Eliud Kipchoge has announced a new bid to run the marathon distance in under two hours. The time Kipchoge set in the London marathon was already the second fastest in history and Kipchoge also holds the record for the fastest ever marathon, at 2:01:39, made in Berlin in 2018. But the sub- 2 hour marathon remains an elusive goal.
In 2016 Nike sponsored an attempt to break the 2-hour target. Three elite runners, including Kipchoge, trained privately to run a marathon-length distance in circuits around the Monza racetrack in Italy. Kipchoge won the race, but in a time of 2:00:25, therefore failing by 25 seconds to hit the 2-hour target. The specialised conditions for this attempt, including the use of relay teams of pace setters, meant that the race fell outside of IAAF standards, and therefore the 2:00:25 is not valid as a world record. Kipchoge’s planned attempt in London will also be made under non-standard conditions, so whatever time he achieves will also not be considered as valid in respect of IAAF rules. Regardless of this, beating the 2-hour barrier would represent a remarkable feat of human achievement, and this is Kipchoge’s goal.
But this begs the question: is a sub- 2 hour marathon under approved IAAF standards plausible? The following graphic shows how the marathon record has improved in the last 100 years or so, from Johnny Hayes’ record of 2:55:18 in 1908, right up to Kipchoge’s Berlin record.
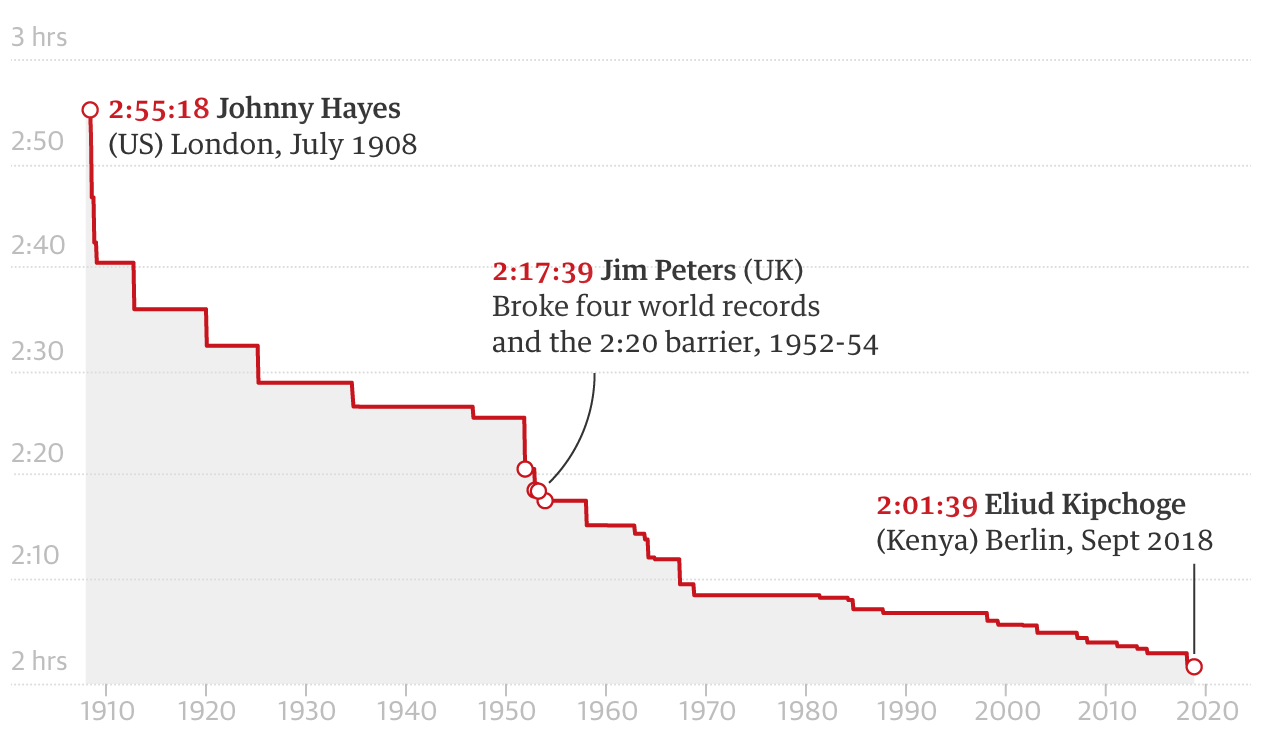
Clearly there’s a law of diminishing returns in operation: the very substantial improvements in the first half of the graph are replaced by much smaller incremental improvements in the second half. This is perfectly natural: simple changes in training regimes and running equipment initially enabled substantial advances; more recent changes are much more subtle, and result in only in marginal improvements. So, the shape of the graph is no surprise. But if you were extrapolating forward to what might happen in the next 10, 100 or 1000 years, would your curve go below the 2-hour threshold or not?
Actually, it’s straightforward to take a set of data, like those contained in the graphic above, and fit a nice smooth curve that does a reasonable job at describing the overall pattern of the graph. And we could then extrapolate that curve into the future and see whether it goes below 2 hours or not. And if it does, we will even have a prediction of when it does.
But there’s a difficulty – the question of whether the solution crosses the 2-hour threshold or not is likely to depend very much on the type of curve we use to do the smoothing. For example, we might decide that the above graphic is best broken down into sections where the pattern has stayed fairly similar. In particular, the most recent section from around 1998 to 2018 looks reasonably linear, so we might extrapolate forward on that basis, in which case the 2-hour threshold is bound to be broken, and pretty soon too. On the other hand we might decide that the whole period of data is best described by a kind of ‘ell’-shaped curve which decreases to a lower horizontal limit. And then the question will be whether that limit is above or below 2 hours. In both cases the data will determine the details of the curve – the gradient of the straight line, for example, or the limit of the ‘ell’-shaped curve – but the form of the graph – linear, ‘ell’-shaped or something else – is likely to be made on more subjective grounds. And yet that choice will possibly determine whether the 2-hour threshold is predicted to be beaten or not.
There’s no way round this difficulty, though statistical techniques have been used to try to tackle it more rigorously. As I mentioned in a previous post, since athletics times are fastest times – whether it’s the fastest time in a race, or the fastest time ever when setting a record – it’s natural to base analyses on so-called extreme value models, which are mathematically suited to this type of process. But this still doesn’t resolve the problem of how to choose the curve which best represents the trend seen in the above picture. And the results aren’t terribly reliable. For example, in an academic paper ‘Records in Athletics Through Extreme-Value Theory‘ written in 2008 the authors John Einmahl and Jan Magnus predicted the absolute threshold times or distances (in case of field events) for a number of athletic events. At the time of writing their paper the world record for the marathon was 2:04:26, and they predicted a best possible time of 2:04:06.
History, of course, proved this to be completely wrong. To be fair to the authors though, they gave a standard error on their estimate of 57 minutes. Without going into detail, the standard error is a measure of how accurate the authors think their best answer is likely to be, and one rule of thumb interpretation of the standard error is that if you give a best answer and a standard error, then you’re almost certain the true value lies within 2 standard errors of your best answer. So, in this case, the authors were giving a best estimate of 2:04:06, but – rather unhelpfully – saying the answer could be as much as 114 minutes faster than that, taking us down to a marathon race time of 0:10:06.
So, come on Kipchoge, never mind the 2-hour marathon, let’s see if you’re up to the 10-minute marathon challenge.
Footnote: don’t trust everything you read in statistical publications. (Except in this blog, of course 😉).
