Generally speaking there are three main phases to any statistical analysis:
- Design;
- Execution;
- Presentation.
Graphical techniques play an important part in both the second and third phases, but the emphasis is different in each. In the second phase the aim is usually exploratory, using graphical representations of data summaries to hunt for structure and relationships that might subsequently be exploited in a formal statistical model. The graphs here tend to be quick but rough, and are intended more for the statistician than the client.
In the presentation phase the emphasis is a bit different, since the analysis has already been completed, usually involving some sort of statistical model and inference. In this case diagrams are used to highlight the results to clients or a wider audience in a way that illustrates most effectively the salient features of the analysis. Very often the strength of message from a statistical analysis is much more striking when presented graphically rather than in the form of numbers. Moreover, some statisticians have also developed the procedure into something of an art form, using graphical techniques not just to convey the results of the analysis, but also to put them back in the context from where the data derive.
One of my favourite exponents of this technique is Mona Chalabi, who has regular columns in the Guardian. among other places.
Here are a few of her examples:
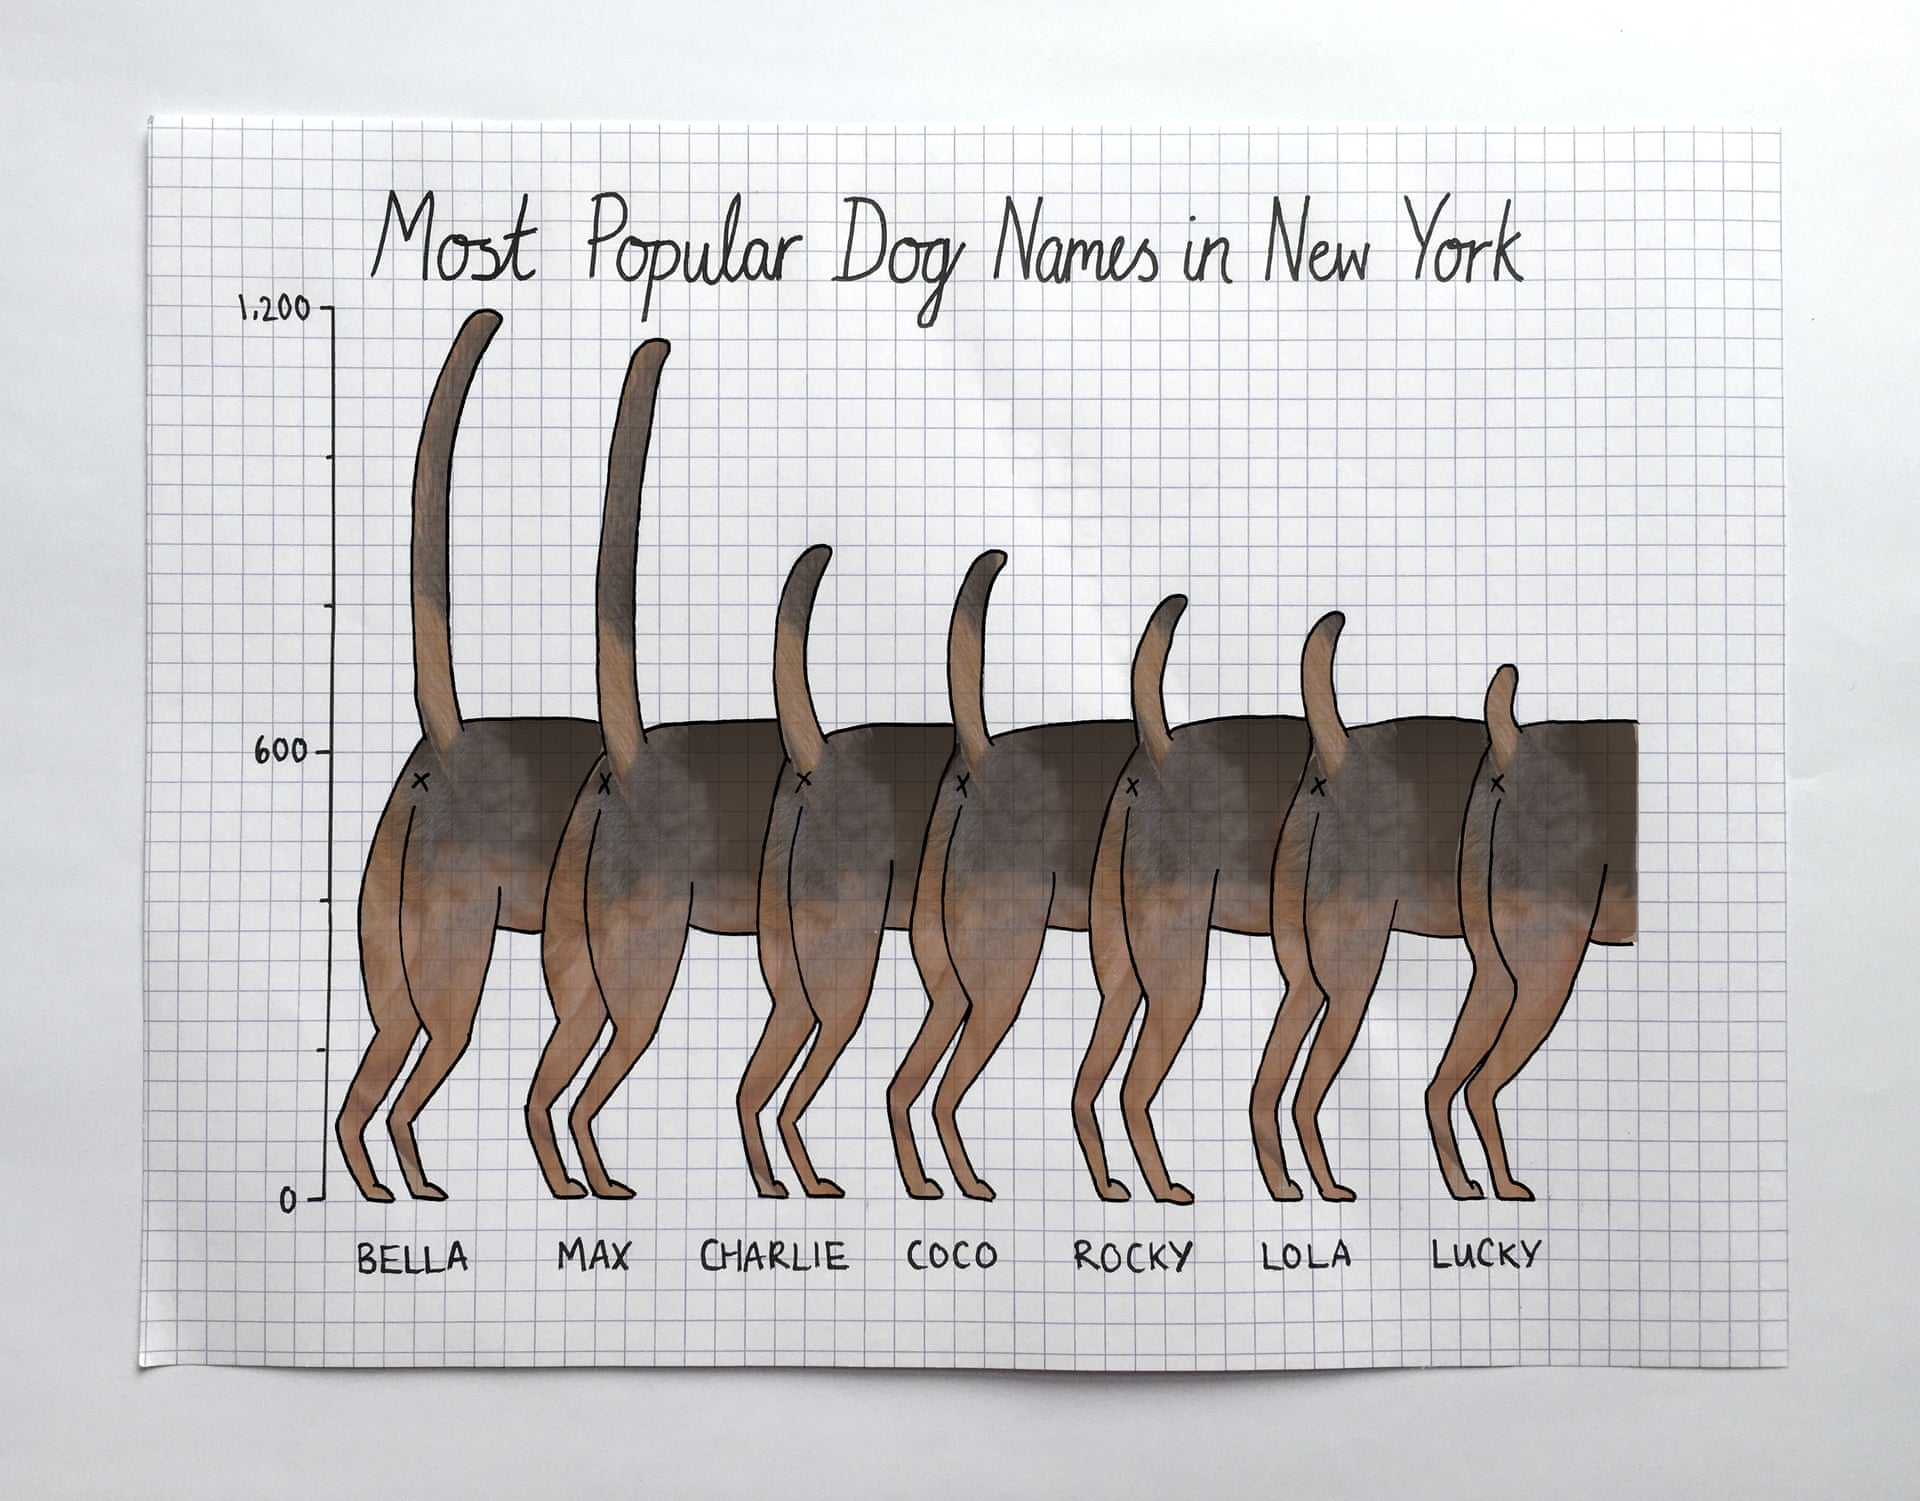
Most Popular Dog Names in New York
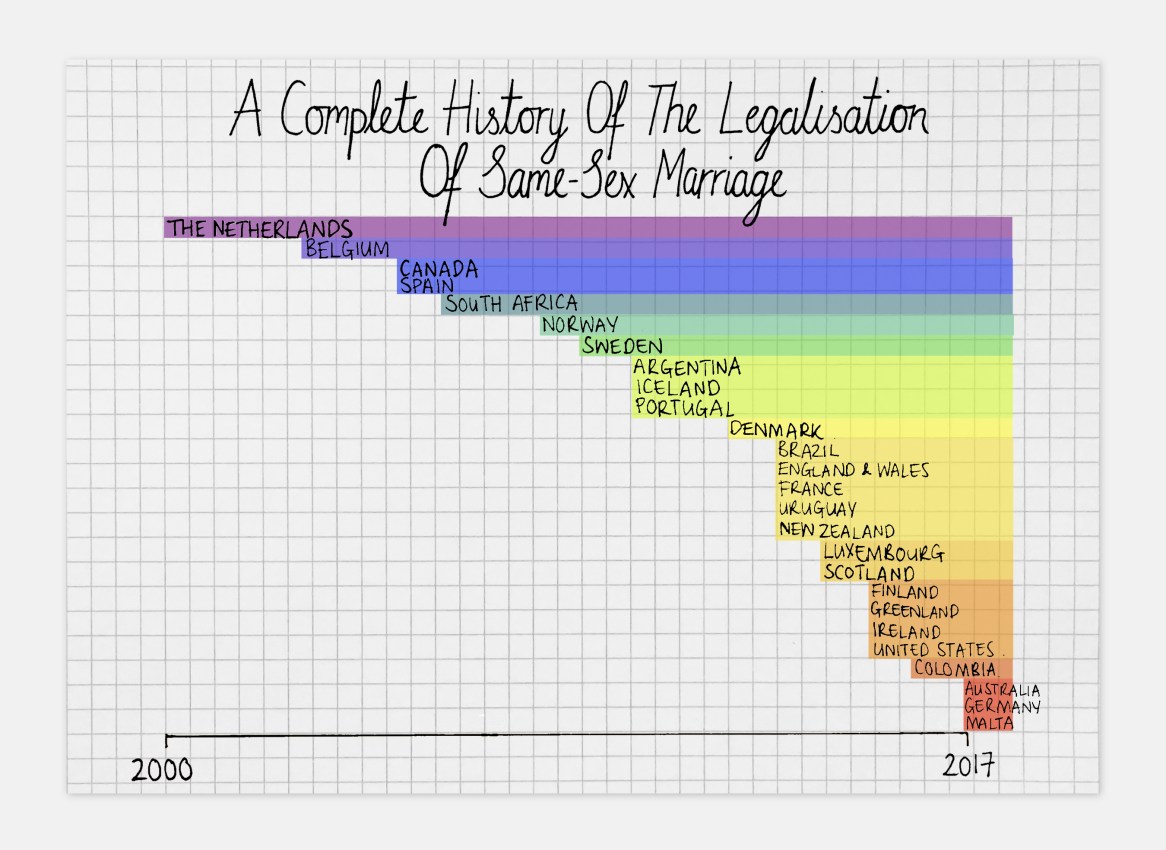
A Complete History of the Legislation of Same-Sex Marriage
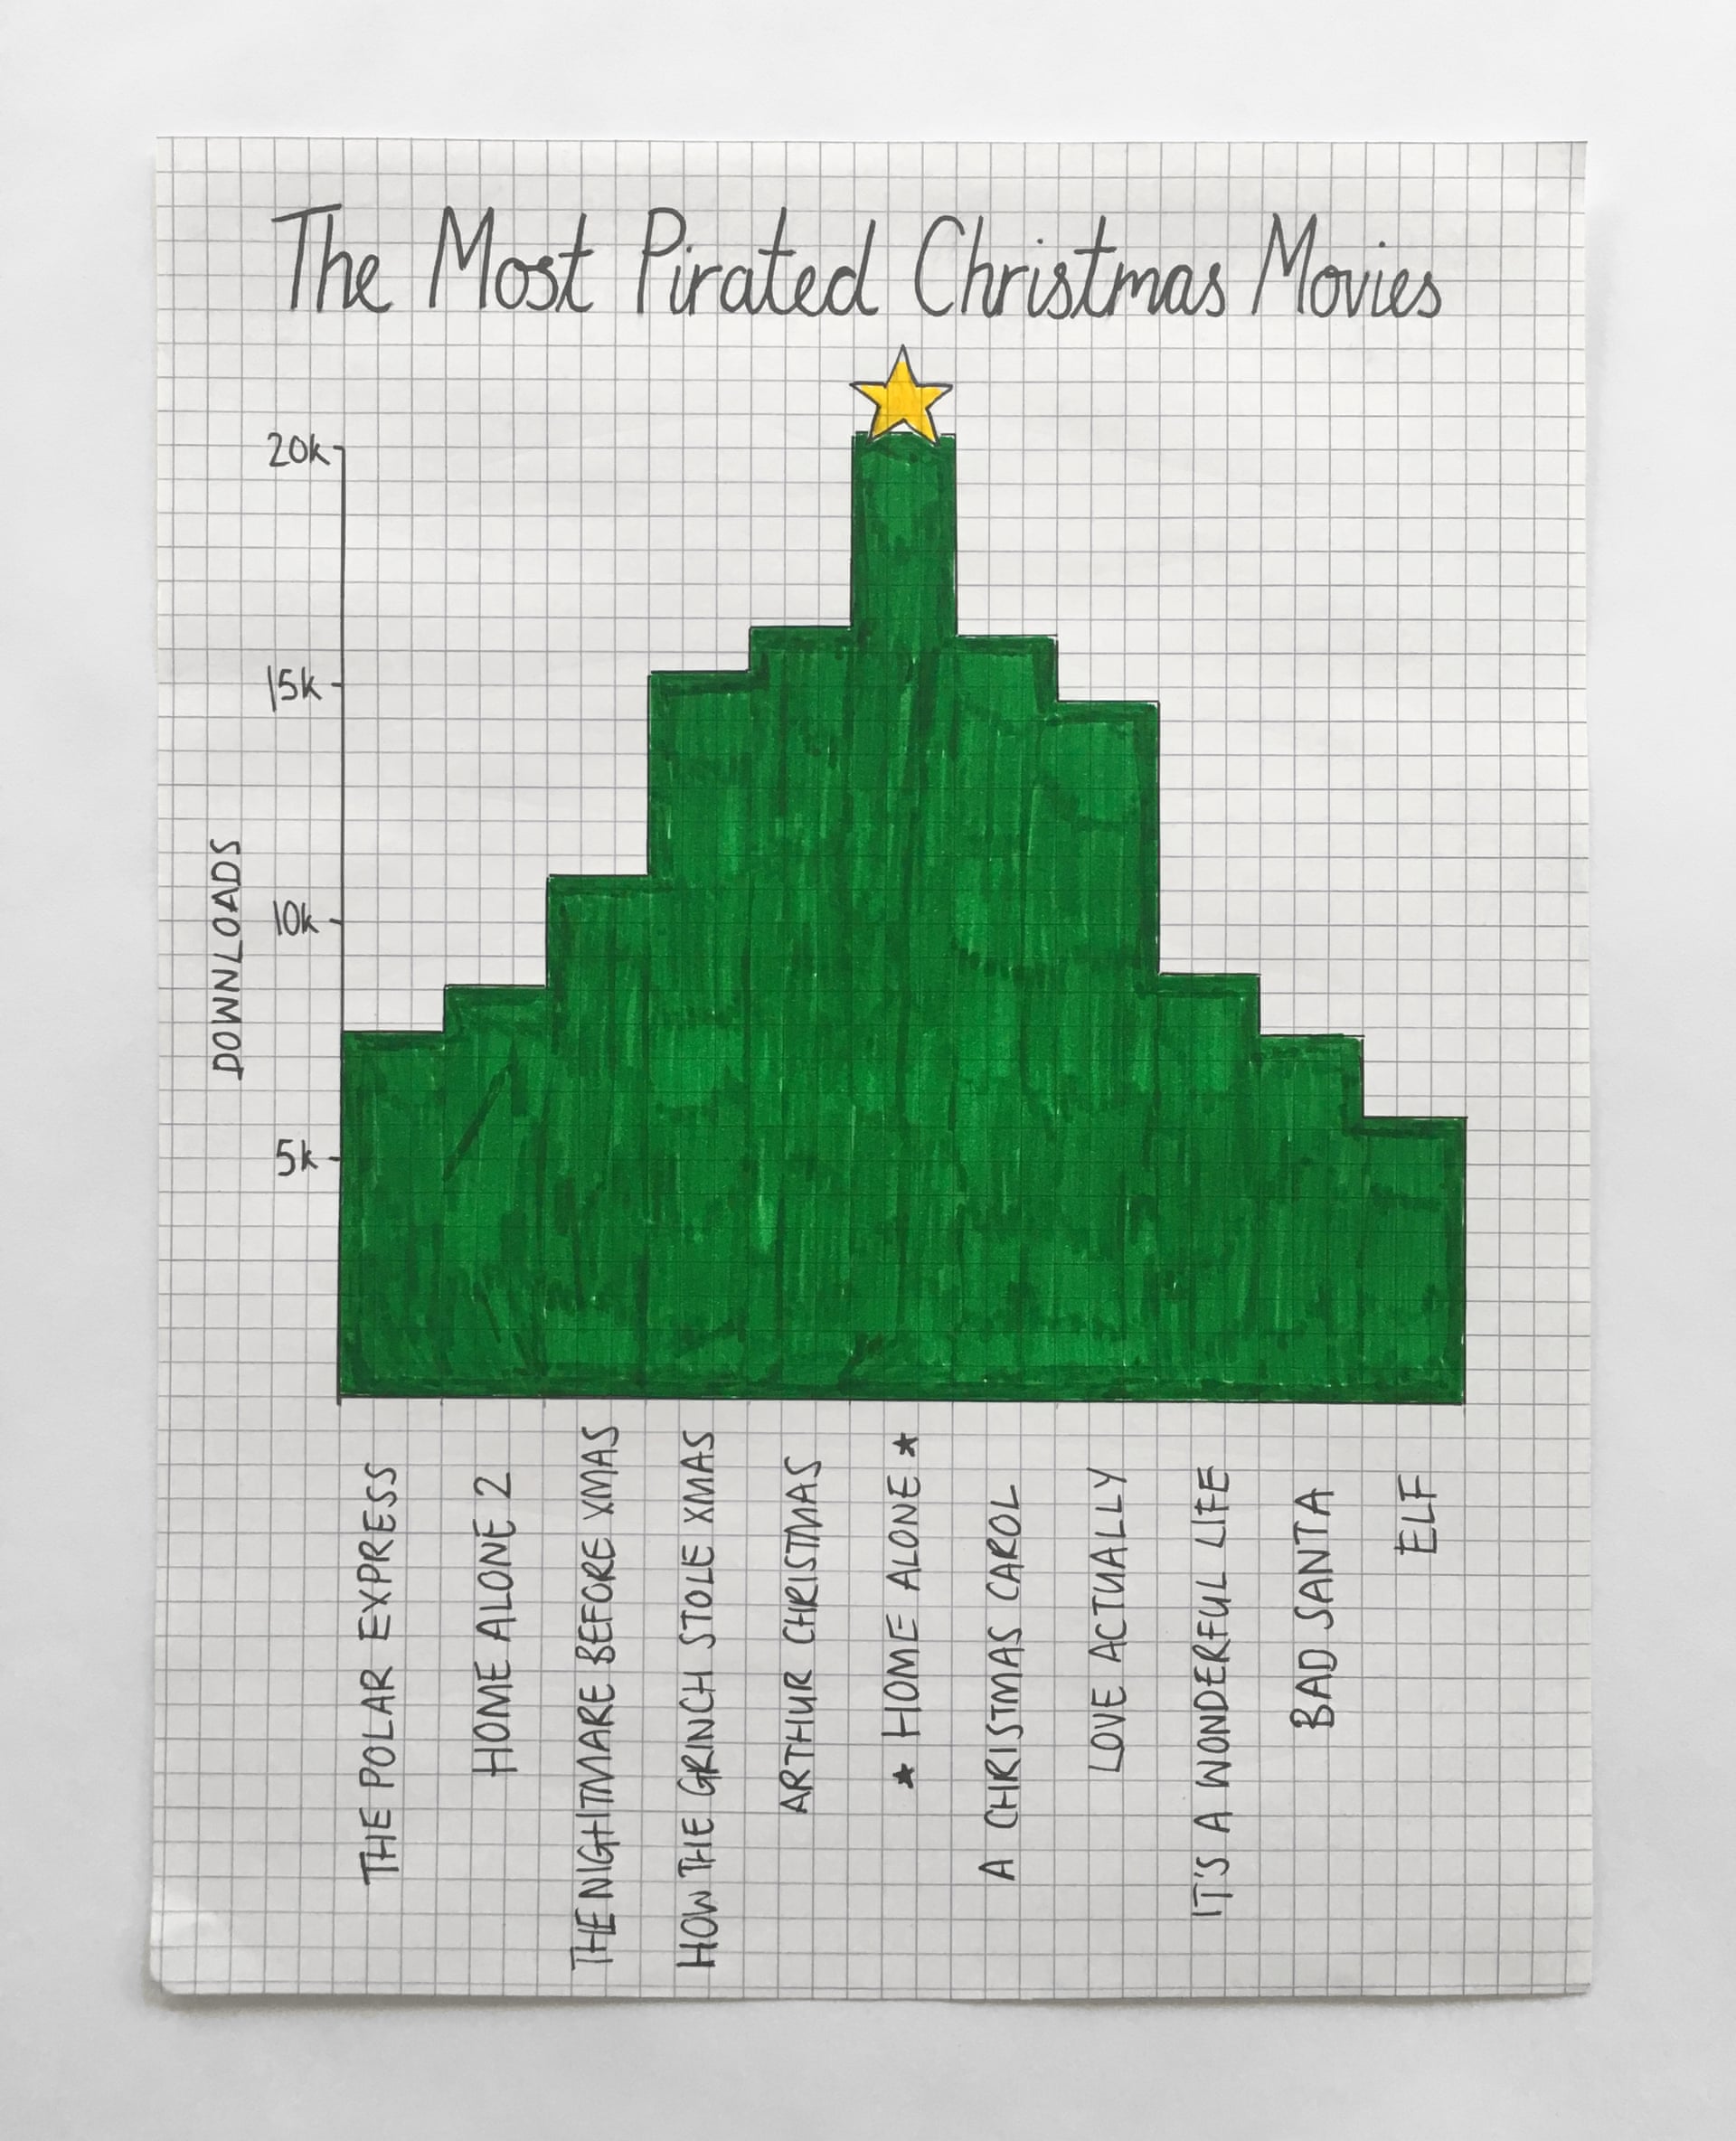
The Most Pirated Christmas Movies
And last and almost certainly least…
Untitled
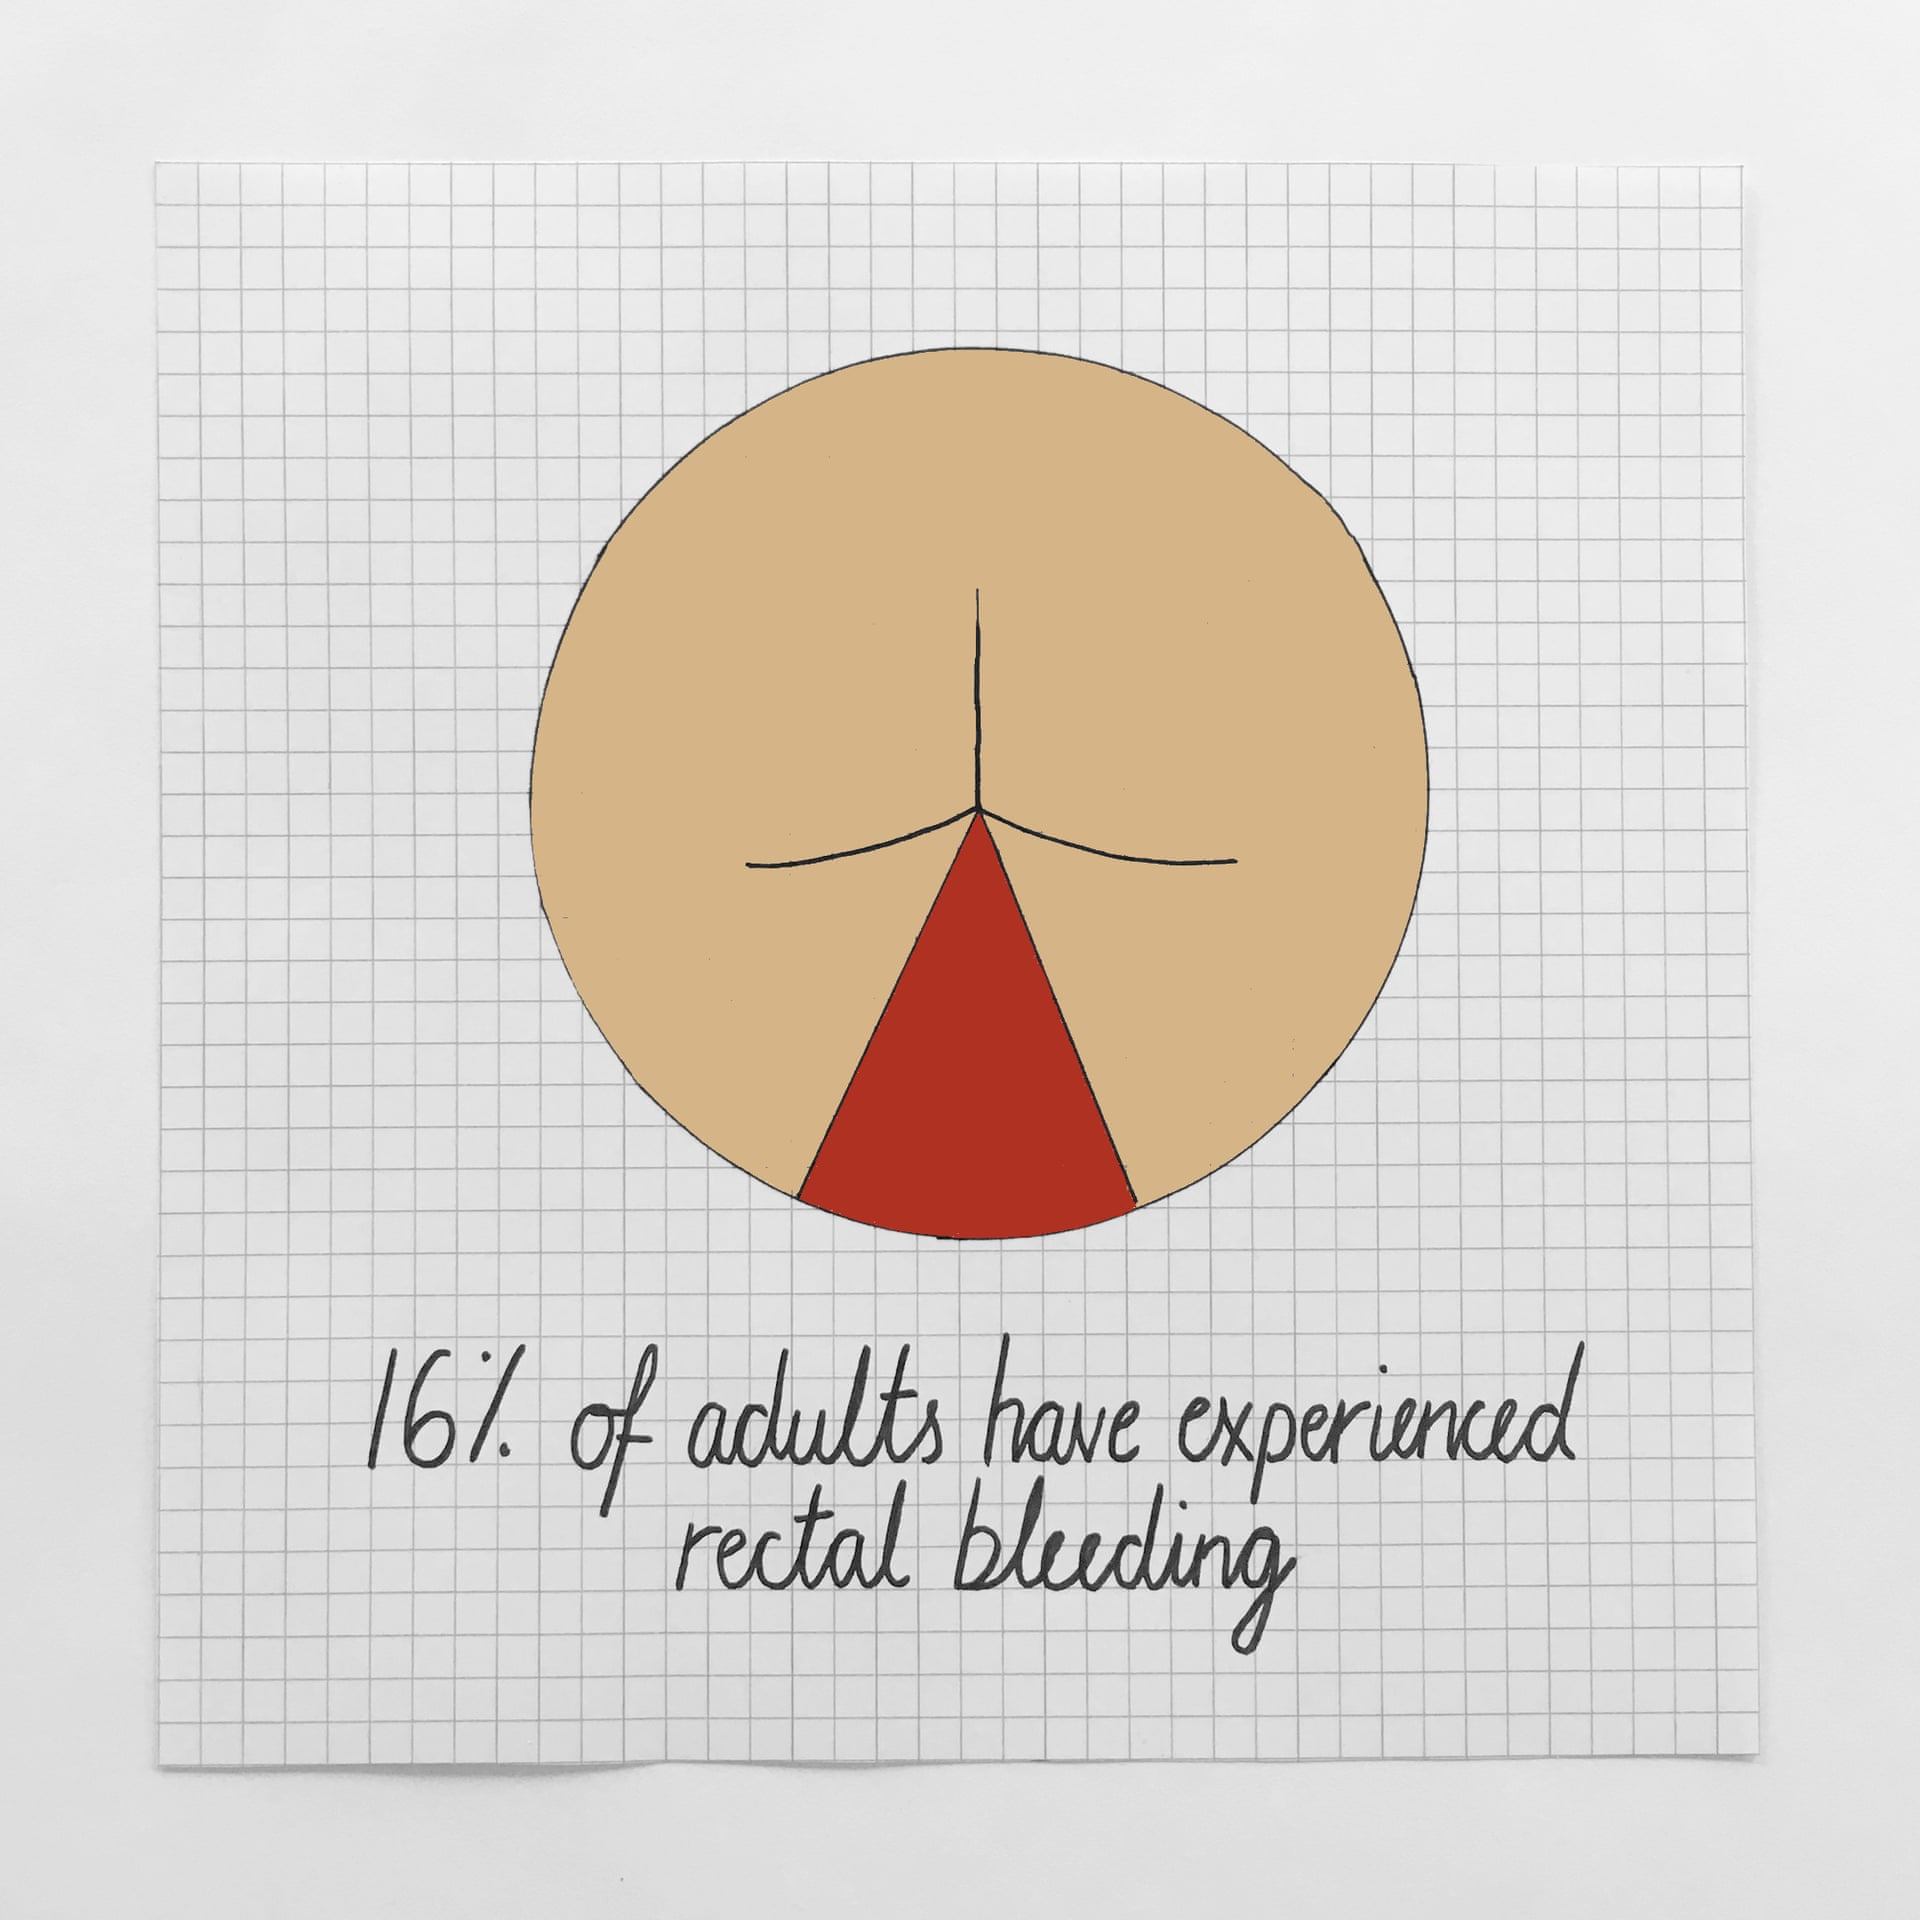
Tell you what though… that looks a bit more than 16% to me, suggesting a rather excessive use of artistic licence in this particular case.
