Consider the following scenario…
A football expert claims that penalties are converted, on average, with a 65% success rate. I collect a sample of games with penalties and find that the conversion rate of penalties in that sample is 70%. I know that samples are bound to lead to some variation in sample results, so I’m not surprised that I didn’t get a success rate of exactly 70% in my sample. But, is the difference between 65% and 70% big enough for me to conclude that the expert has got it wrong? And would my conclusions be any different if the success rate in my sample had been 80%? Or 90%?
This type of issue is at the heart of pretty much any statistical investigation: judging the reliability of an estimate provided by a sample, and assessing whether its evidence supports or contradicts some given hypothesis?
Actually, it turns out that with just the information provided above, the question is impossible to answer. For sure, a true success rate of 65% is more plausible with a sample value of 70% than it would have been with a sample value of 80% or 90%. And just as surely, having got a sample value of 70%, a true value of 65% is more plausible than a true value of 60%. But, the question of whether the sample value of 70% actually supports or opposes the claim of a true value of 65% is open.
To answer this question we need to know whether a sample value of 70% is plausible or not if the true value is 65%. If it is, we can’t say much more: we’d have no reason to doubt the 65% value, although we still couldn’t be sure – we can never be sure! – that this value is correct. But if the sample value of 70% is not plausible if the population value is 65%, then this claim about the population is likely to be false.
One way of addressing this issue is to construct a confidence interval for the true value based on the sample value. Without getting too much hung up on technicalities, a confidence interval is a plausible range for the population value given the sample value. A 95% confidence interval is a range that will contain the true value with probability 95%; a 99% confidence interval is a range that will contain the true value with probability 99%; and so on.
So why not go with a 100% confidence interval? Well, in most circumstances this would be an interval that stretches to infinity in both directions, and we’d be saying that we can be 100% sure that the true value is between plus and minus infinity. Not very helpful. At the other extreme, a 1% confidence interval would be very narrow, but we’d have virtually no confidence that it contained the true value. So, it’s usual to adopt 95% or 99% confidence intervals as benchmarks, as they generally provide intervals that are both short enough and with high enough confidence to give useful information.
For problems as simple as the one above, calculating confidence intervals is straightforward. But, crucially, the size of the confidence interval depends on the size of the data sample. With small samples, there is more variation, and so the confidence intervals are wider; with large samples there is less variation, and the confidence intervals are more narrow.
The following graph illustrates this for the example above.
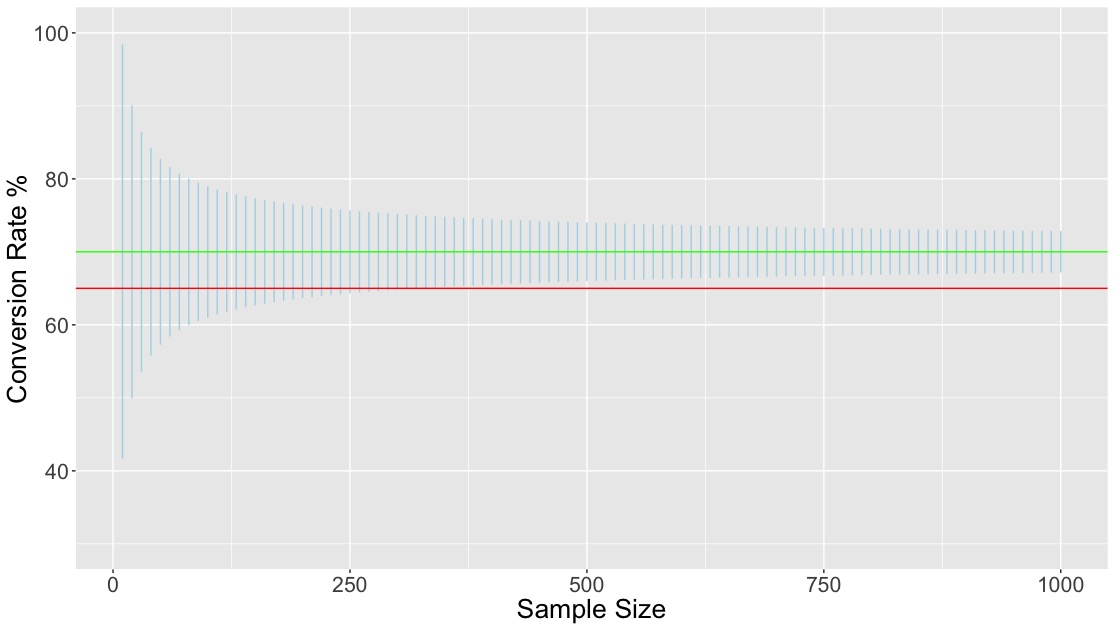
- The horizontal axis gives different values for the size of the sample on which the value of 70% was based.
- The horizontal red line shows the hypothesised population value of 65%
- The horizontal green line shows the observed sample value of 70%.
- For each choice of sample size, the vertical blue line shows a 95% confidence interval for the true population value based on the sample value of 70%.
What emerges is that up until a sample size of 300 or so, the 95% confidence interval includes the hypothesised value of 65%. In this case, the observed data are consistent with the hypothesis, which we therefore have no reason to doubt. For larger sample sizes, the hypothesised value falls outside of the interval, and we would be led to doubt the claim of a 65% success rate. In other words: (sample) size does matter. It determines how much variation we can anticipate in estimates, which in turn determines the size of confidence intervals and by extension the degree to which the sample data can be said to support or contradict the hypothesised value.
The story is much the same with 99% confidence intervals, as shown in the following figure.
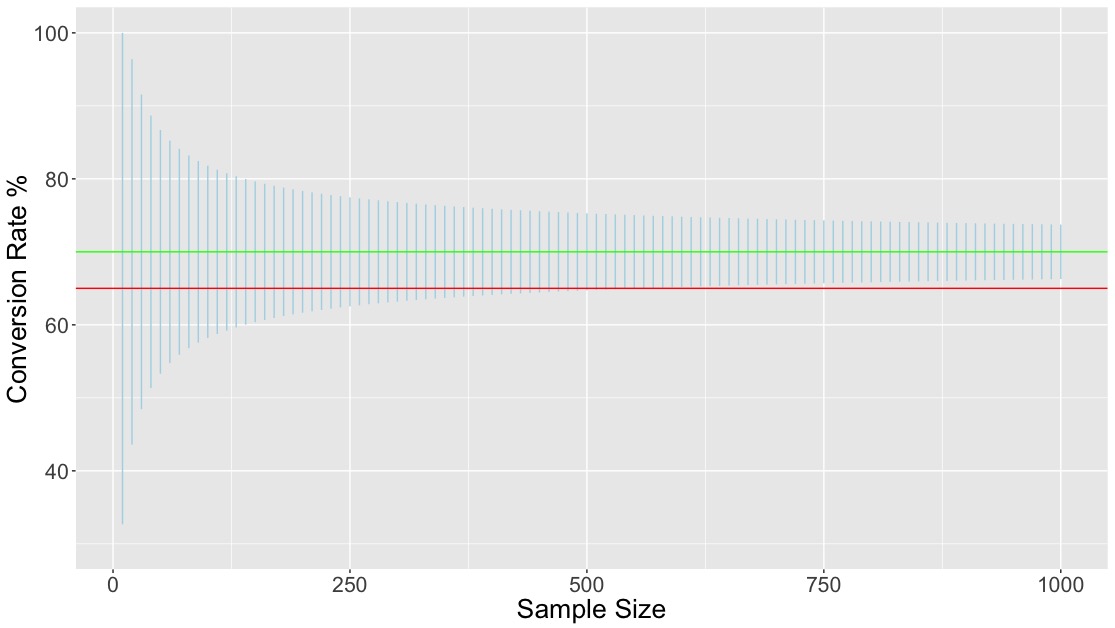
The intervals are wider, but the overall pattern is much the same. However, with this choice the data contradict the hypothesis only for sample sizes of around 500 or more.
Whether you choose to base your decisions on intervals of confidence 95%, 99% or some other level is a matter of preference. In particular, there are two types of errors we can make: we might reject the hypothesised value when it’s true, or accept it when it’s false. Using 99% intervals rather than 95% will reduce the chance of making the first error, but increase the chance of the second. We can’t have it both ways. The only way of reducing the chances of both of these types of errors is to increase the sample size. Again: size matters.
Footnote: one thing worth noting in the figures above is that the confidence intervals change in length quite quickly when the sample size is small, but more slowly when the sample size is large. This can be stated more precisely: to make a confidence interval half as wide you have to multiply the sample size by 4. So if your sample size is 10, you just need to increase it to 40 to make confidence intervals half as wide; but if the sample size is 100, you have to increase it to 400. It’s a sort of law of diminishing returns, which has important consequences if data are expensive. An initial investment of, say, £100’s worth of data will give you answer with a certain amount of accuracy, but each further investment of £100 will improve accuracy by a smaller and smaller amount. At what point is the cost of potential further investment too great for the benefits it would lead to?
