The substance of this post, including the terrible joke in the finale, is all stolen from here.

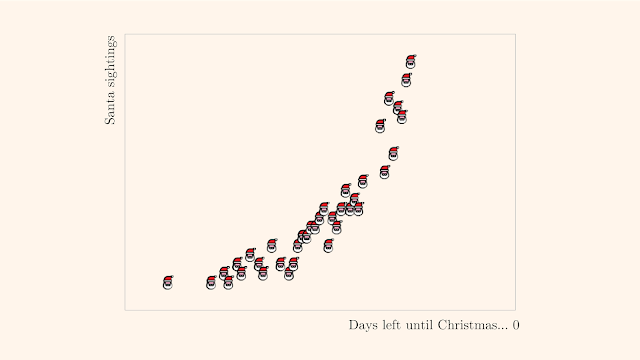
Look at this graph. The Santas represent points on the graph, and broadly show that the closer you get to Christmas, the more numerous the sightings of Santa. (Presumably in supermarkets and stores, rather than in grottos and sleighs, but you get the idea).
As discussed in previous posts – here, for example – we can measure the extent to which these two variables are related using the correlation coeffiecient. If the data lined up perfectly on an increasing straight line, the correlation would be 1. If the variables were completely unrelated, the correlation would be close to zero. (Unlikely to be exactly zero, due to random variation).
For the Santa data, the correlation is probably around 0.95. It’s not quite 1 for two reasons: first there’s a bit of noise around the general trend between the variables; second, the relationship itself looks slightly curved. But anyway, there’s a clear pattern to be observed: as Christmas approaches, the sightings of Santa increase. And this would manifest itself with a correlation coefficient close to 1.
What’s the effect of this relationship? Well, changing the time period before Christmas – say moving from a month before Christmas to a week before Christmas – will change the number of Santas you’re likely to see. But does it work the other way round? If we dressed a few extra people up as Santa, would it change the number of days left till Christmas? Clearly not. There’s a cause and effect between the two variables in the graphs, but it only works in one direction. The number of days left till Christmas affects the number of Santas you see on the street, but it simply doesn’t work the other way around.
Conclusion:
Correlation doesn’t imply Clausality!
Hohoho.
Footnote: the correct version of this phrase, ‘Correlation doesn’t imply Causality’, was the subject of an earlier post.
