In an earlier post I included the following table:
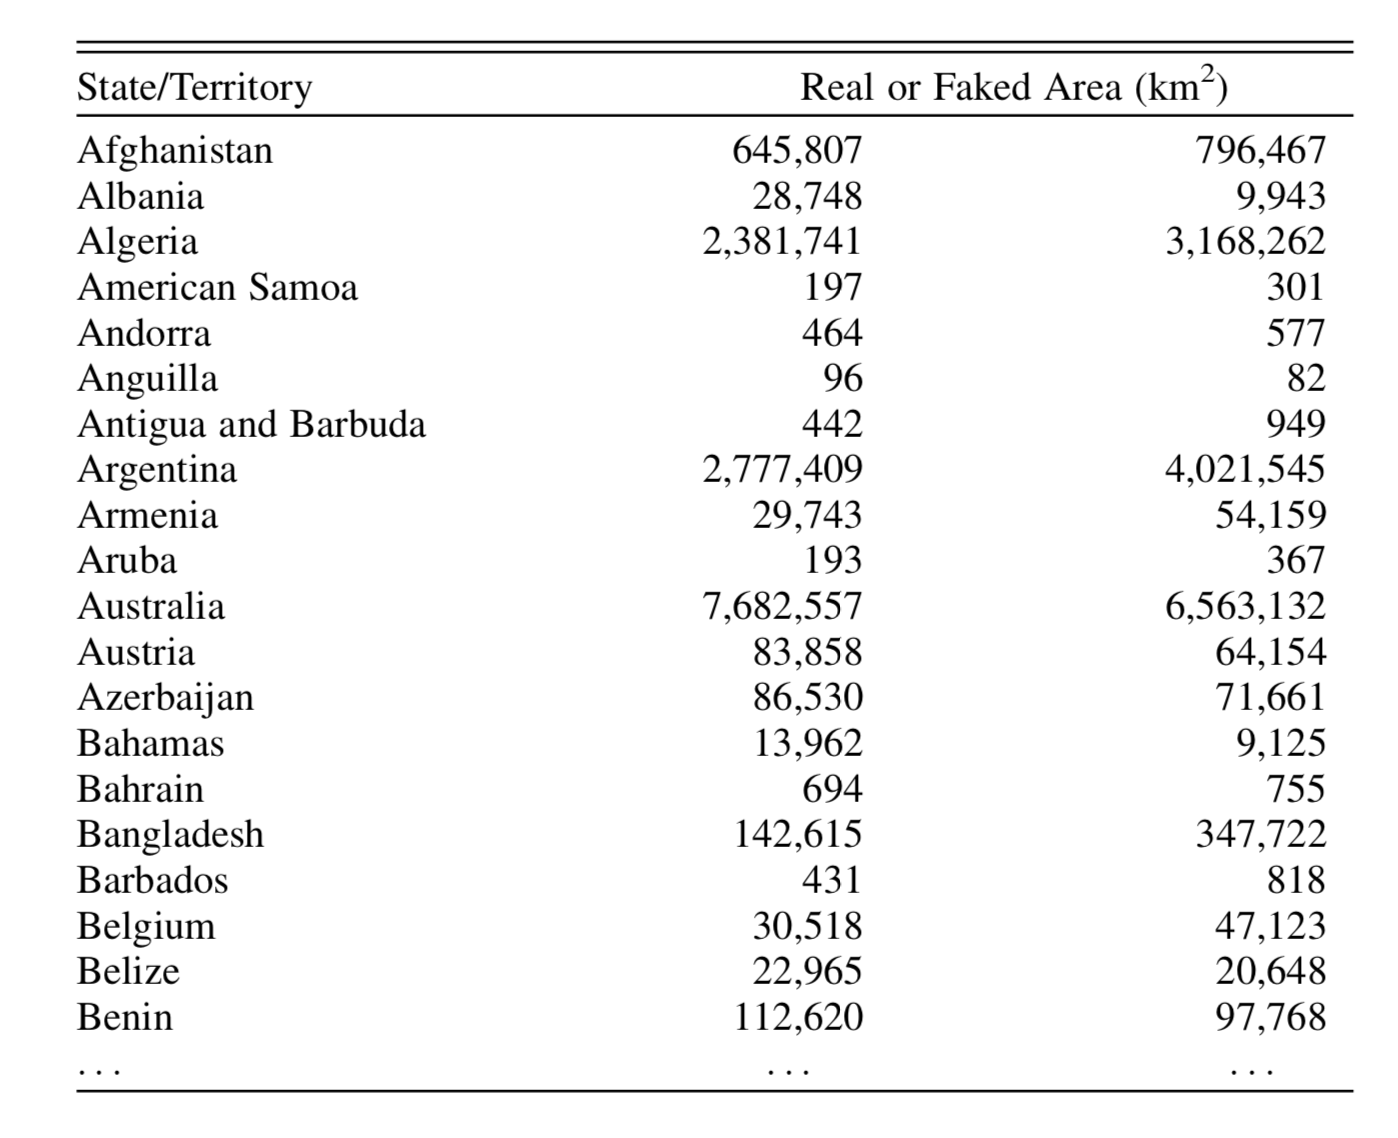
As I explained, one of the columns contains the genuine land areas of each country, while the other is fake. And I asked you which is which.
The answer is that the first column is genuine and the second is fake. But without a good knowledge of geography, how could you possibly come to that conclusion?
Well, here’s a remarkable thing. Suppose we take just the leading digit of each of the values. Column 1 would give 6, 2, 2, 1,… for the first few countries, while column 2 would give 7, 9, 3, 3,… It turns out that for many naturally occurring phenomena, you’d expect the leading digit to be 1 on around 30% of occasions. So if the actual proportion is a long way from that value, then it’s likely that the data have been manufactured or manipulated.
Looking at column 1 in the table, 5 out of the 20 countries have a population with leading digit 1; that’s 25%. In column 2, none do; that’s 0%. Even 25% is a little on the low side, but close enough to be consistent with 30% once you allow for discrepancies due to random variations in small samples. But 0% is pretty implausible. Consequently, column 1 is consistent with the 30% rule, while column 2 is not, and we’d conclude – correctly – that column 2 is faking it.
But where does this 30% rule come from? You might have reasoned that each of the digits 1 to 9 were equally likely – assuming we drop leading zeros – and so the percentage would be around 11% for a leading digit of 1, just as it would be for any of the other digits. Yet that reasoning turns out to be misplaced, and the true value is around 30%.
This phenomenon is a special case of something called Benford’s law, named after the physicist Frank Benford who first formalised it. (Though it had also been noted much earlier by the astronomer Simon Newcomb). Benford’s law states that for many naturally occurring datasets, the probability that the leading digit of a data item is 1 is equal to 30.1%. Actually, Benford’s law goes further than that, and gives the percentage of times you’d get a 2 or a 3 or any of the digits 1-9 as the leading digit. These percentages are shown in the following table.
| Leading Digit | 1 | 2 | 3 | 4 | 5 | 6 | 7 | 8 | 9 |
|---|---|---|---|---|---|---|---|---|---|
| Frequency | 30.1% | 17.6% | 12.5% | 9.7% | 7.9% | 6.7% | 5.8% | 5.1% | 4.6% |
For those of you who care about such things, these percentages are log(2/1), log(3/2), log(4/3) and so on up to log(10/9), where log here is logarithm with respect to base 10.
But does Benford’s law hold up in practice? Well, not always, as I’ll discuss below. But often it does. For example, I took a dataset giving the altitudes of a large set of football stadiums around the world. I discarded a few whose altitude is below sea level, but was still left with over 13,000 records. I then extracted the leading digit of each of the altitudes (in metres) and plotted a histogram of these values. This is just a plot of the percentages of occasions each value occurred. These are the blue bars in the following diagram. I then superimposed the predicted proportions from Benford’s law. These are the black dots.
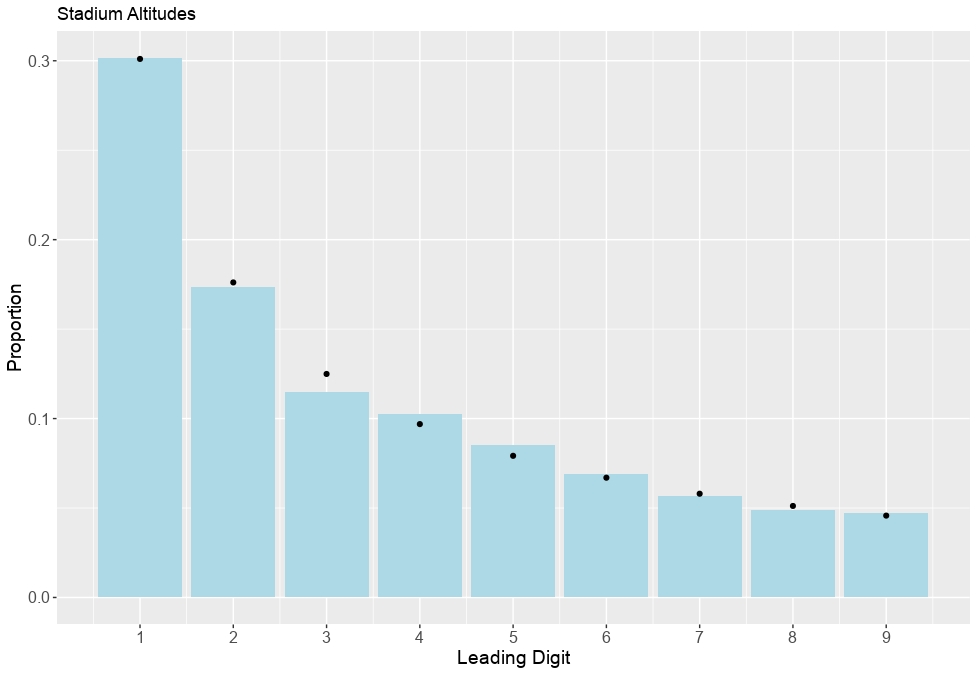
The agreement between the observed percentages and those predicted by Benford’s law is remarkable. In particular, the observed percentage of leading digits equal to 1 is almost exactly what Benford’s law would imply. I promise I haven’t cheated with the numbers.
As further examples, there are many series of mathematically generated numbers for which Benford’s law holds exactly.
These include:
- The Fibonacci series: 1, 1, 2, 3, 5, 8, 13, …. where each number is obtained by summing the 2 previous numbers in the series.
- The integer powers of two: 1, 2, 4, 8, 16, 32, …..
- The iterative series obtained by starting with any number and successively multiplying by 3. For example, starting with 7, we get: 7, 21, 63, 189,….
In each of these cases of infinite series of numbers, exactly 30.1% will have leading digit equal to 1; exactly 17.6% will have leading digit equal to 2, and so on.
And there are many other published examples of data fitting Benford’s law (here, here, here… and so on.)
Ok, at this point you should pause to revel in the amazement of this stuff. Sometimes mathematics, Statistics and probability come together in a way to explain naturally occurring phenomena that is so surprising and shockingly elegant it takes your breath away.
So, when does Benford’s law work. And why?
It turns out there are various ways of explaining Benford’s law, but none of them – at least as far as I can tell – is entirely satisfactory. All of them require a leap of faith somewhere to match the theory to real-life. This view is similarly expressed in an academic article, which concludes:
… there is currently no unified approach that simultaneously explains (Benford’s law’s) appearance in dynamical systems, number theory, statistics, and real-world data.
Despite this, the various arguments used to explain Benford’s law do give some insight into why it might arise naturally in different contexts:
- If there is a law of this type, Benford’s law is the only one that works for all choices of scale. The decimal representation of numbers is entirely arbitrary, presumably deriving from the fact that humans, generally, have 10 fingers. But if we’d been born with 8 fingers, or chosen to represent numbers anyway in binary, or base 17, or something else, you’d expect a universal law to be equally valid, and not dependent on the arbitrary choice of counting system. If this is so, then it turns out that Benford’s law, adapted in the obvious way to the choice of scale, is the only one that could possibly hold. An informal argument as to why this should be so can be found here.
- If the logarithm of the variable under study has a distribution that is smooth and roughly symmetric – like the bell-shaped normal curve, for example – and is also reasonably well spread out, it’s easy to show that Benford’s law should hold approximately. Technically, for those of you who are interested, if X is the thing we’re measuring, and if log X has something like a normal distribution with a variance that’s not too small, then Benford’s law is a good approximation for the behaviour of X. A fairly readable development of the argument is given here. (Incidentally, I stole the land area of countries example directly from this reference.)
But in the first case, there’s no explanation as to why there should be a universal law, and indeed many phenomena – both theoretical and in nature – don’t follow Benford’s law. And in the second case, except for special situations where the normal distribution has some kind of theoretical justification as an approximation, there’s no particular reason why the logarithm of the observations should behave in the required way. And yet, in very many cases – like the land area of countries or the altitude of football stadiums – the law can be shown empirically to be a very good approximation to the truth.
One thing which does emerge from these theoretical explanations is a better understanding of when Benford’s law is likely to apply and when it’s not. In particular, the argument only works when the logarithm of the variable under study is reasonably well spread out. What that means in practice is that the variable itself needs to cover several orders of magnitude: tens, hundreds, thousands etc. This works fine for something like the stadium altitudes, which vary from close to sea-level up to around 4,000 metres, but wouldn’t work for total goals in football matches, which are almost always in the range 0 to 10, for example.
So, there are different ways of theoretically justifying Benford’s law, and empirically it seems to be very accurate for different datasets which cover orders of magnitude. But does it have any practical uses? Well, yes: applications of Benford’s law have been made in many different fields, including…
- Fraud detection in accounting;
- Legal cases in the United States
- Identification of money laundering;
- Problem detection in real estate;
- Genetics;
- Macroeconomics;
- Information security.
Finally, there’s also a version of Benford’s law for the second digit, third digit and so on. There’s an explanation of this extension in the Wikipedia link that I gave above. It’s probably not easy to guess exactly what the law might be in these cases, but you might try and guess how the broad pattern of the law changes as you move from the first to the second and to further digits.
Thanks to those of you wrote to me after I made the original post. I don’t think it was easy to guess what the solution was, and indeed if I was guessing myself, I think I’d have been looking for a uniformity in the distribution of the digits, which turns out to be completely incorrect, at least for the leading digit. Even though I’ve now researched the answer myself, and made some sense of it, I still find it rather shocking that the law works so well for an arbitrary dataset like the stadium altitudes. Like I say: revel in the amazement.
