Football, like all sports, has many ‘old chestnuts’ – beliefs about the game that have folklore status and are widely shared as being incontrovertible truths, regardless of the availability of evidence to support them. For example:
- Teams are often most vulnerable after scoring;
- Teams often find it easier when playing against 10 men;
- 2-0 is the most dangerous winning lead;
- 40 points in the Premier League is enough to avoid relegation.
Statistics provides a tool for getting beneath the surface of such myths, and to determine whether they actually have any basis in fact. And sometimes the statistical analysis can be remarkably simple. For example:
Hypothesis: 40 points in the Premier League is enough to avoid relegation
Data: Premier League Table, 2002-03. West Ham were relegated with 42 points.
Conclusion: 40 points in the Premier League are not necessarily enough to avoid relegation.
Of course, this is also a question that can be addressed mathematically, without recourse to Statistics. Suppose there’s a season where two teams lose all of their games, except when playing each other. The other teams win all of their home games, but lose all of their away games, except against the two terrible teams, which they win. Then apart from the two bad teams, all other teams will win 19 games at home, 2 games away, and lose their remaining away games. They will therefore score 63 points over the season, and the team among them with the poorest goal difference will be relegated, together with the two bad teams. It follows that, in theory, a total of 64 points is required to be 100% certain of avoiding relegation.
But that’s not really what people mean when they ask the 40-point question. What they really mean is whether 40 points is very likely to be enough to avoid relegation. We’ve seen that 40 points isn’t enough, either mathematically or historically. But just how likely is it that a team scoring 40 points will be relegated from the Premier League?
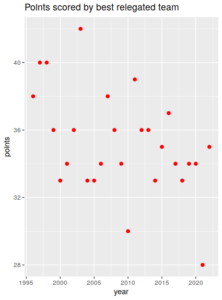
Prior to the 1995-96 season the league had 22 teams, so comparison with subsequent seasons, in which the number of teams has remained stable at 20, would be inappropriate. So we’ll stick to the period from 1995-96 to the 2021-22 season. The number of points obtained in of those seasons is shown in the following graph:

You can see West Ham’s points total of 42 in 2003, and also that there were two earlier occasions – 1997 and 1998 – when teams got relegated with a total of exactly 40 points. On this basis, since there have been 3 occasions in 27 seasons that teams have gone down with 40 points or more, we might conclude that the probability that the chance of a team being relegated with 40 points or more in a season is 3/27, or around 11%.
But there are at least 2 reasons why the 11% value itself may be misleading. First, the graph gives the visual impression that the number of points obtained by the best relegated side has, in general, been declining over the years. And this is plausible: the difference in wealth between the best and poorest teams in the league has grown considerably. For example, the difference in wealth between Manchester City and Norwich has grown from 103 million euros in 2013 to 815 million euros in 2021 (here and here respectively). This is a near 800% increase over a period where inflation would have implied just a 13% increase. So the gap between the richest and poorest teams in the Premier League has grown massively, and it would hardly be a surprise if the poorer teams are scoring fewer points, as the above graph suggests.
A second reason that the 11% figure may be unreliable is that the number of seasons on which it is based is very small – just 27. So while it’s true that 40 points failed to be enough to avoid relegation in just 3 of those seasons, with such a small sample it would be foolish to assume that the figure of 11% can be regarded as a reliable indicator of risk for future seasons.
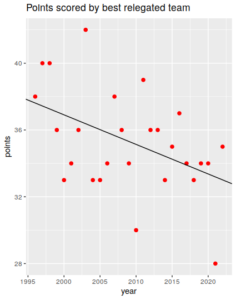
Let’s look at both these issues in more detail. First, using standard statistical methods, we can add a trend line to the above plot as follows:

For these particular data, the assumptions on which this line were calculated are strictly implausible, but it’s fair to say that the line gives a reasonable representation of the trend in the data. Moreover, notwithstanding the dubious assumptions, the statistical evidence that the trend line points downwards is very strong. That’s to say, the picture of a decreasing trend is very likely to be genuine, rather than a statistical blip caused by random season-to-season variation.
In light of this, the value of 11% as a measure of the chance of being relegated with 40 points or more is most likely an over-estimate for the 2021-22 season, but we’ve already noted that lack of data is a problem, so what can we do to get a better estimate?
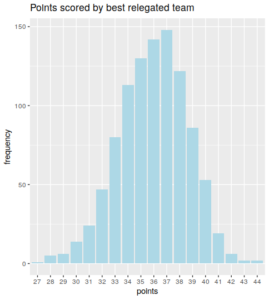
One option is to use simulation. I used a standard model for football that enables simulation of the result of any match based on the estimated strength of the 2 teams playing that match. I repeated this for every match of the 2021-22 season, and calculated the points total for all teams, based on the simulated season of results. Using the simulated table, I also noted the total number of points of the team finishing 18th in the league. I then repeated this exercise 1000 times and obtained the following frequency distribution of points scored by the team finishing 18th:
:
For example, the most frequent number of points for the team finishing 18th in these simulated seasons was 37. More importantly, there were a total of 82 occasions on which the 18th placed side scored 40 points or more, so my estimated probability for such an event is 82/1000, or around 8%. I also tried randomising the fixture schedule for each season, since we might be interested in seasons ‘like’ the 21/22 season, but not identical to it. Results in this case were very similar.
As such, whether the fixture schedule is fixed to be the true one, or randomised across all possible schedules, the probability for the 21/22 season that the best relegated team would have had 40 points or more is approximately 8%. This is somewhat lower than the 11% obtained above from the simple empirical analysis that ignored the possible trend in the data.
In summary, beyond the simple conclusion that 40 points definitely doesn’t guarantee safety from relegation, we can conclude that:
- Overall, a team with 40 points or more has been relegated from the Premier League in 11% of seasons;
- There is evidence that the average number of points needed to avoid relegation has reduced over the years;
- A reasonable estimate for the chance that a team would have been relegated in the 2021-22 season with more than 40 points is about 8%.
You can probably see why the use of Statistics in this way – for identifying whether there is any truth behind such ‘old chestnuts’ – might be useful in a gambling context. If markets are driven, even very slightly, by a ‘wisdom’ that is actually false, there is likely to be value on opposing bets. Had you been offered a bet with a price of at least 12.5 on the best-placed team being relegated in the 2021-22 season having 40 points or more, it would have been a good value bet. You’d have lost, but you’d have lost with the knowledge that your losing bet had good value!
Thanks to Luigi.Colombo@Smartoods.co.uk for suggesting a post along these lines. If you have ideas for topics for future posts, please contact me directly or via the comments section of this blog.
