“Io resto a casa” translates as “I’m staying home” and is the latest message of solidarity against Coronavirus here in Italy. As you’ll know, Italy went into lockdown a couple of weeks before the UK. Based on model and expert predictions, we should start to see some improvement in numbers round-about now. Actually, numbers did improve for a couple of days, but the most recent numbers have suggested stability, rather than a downturn. Some random variation in numbers is inevitable, even if the trend now is for things to get better, but still it’s disheartening when numbers don’t improve as quickly as you’d hoped.
With this in mind, although the models show that the reduction in transmission rates that result from a lockdown will actually result in an improvement, what evidence is there that this approach works in practice?
In part, there’s the evidence from China, who managed to bring their epidemic under almost total control in a fairly short space of time. Given both the size and spread of the population in China, this has been an incredible achievement. But the social-distancing and quarantining methods used there were considerably more restrictive than those used in western countries, so how can we be sure that the measures applied in Italy and the UK will have a similar impact?
I also gave an answer to this in a previous post, which compared the trajectory of the epidemic in two provinces of Lombardia – Lodi, which introduced an early lockdown and Bergamo which did so much later – and showed that an early lockdown led to a much flatter subsequent trajectory of the epidemic.
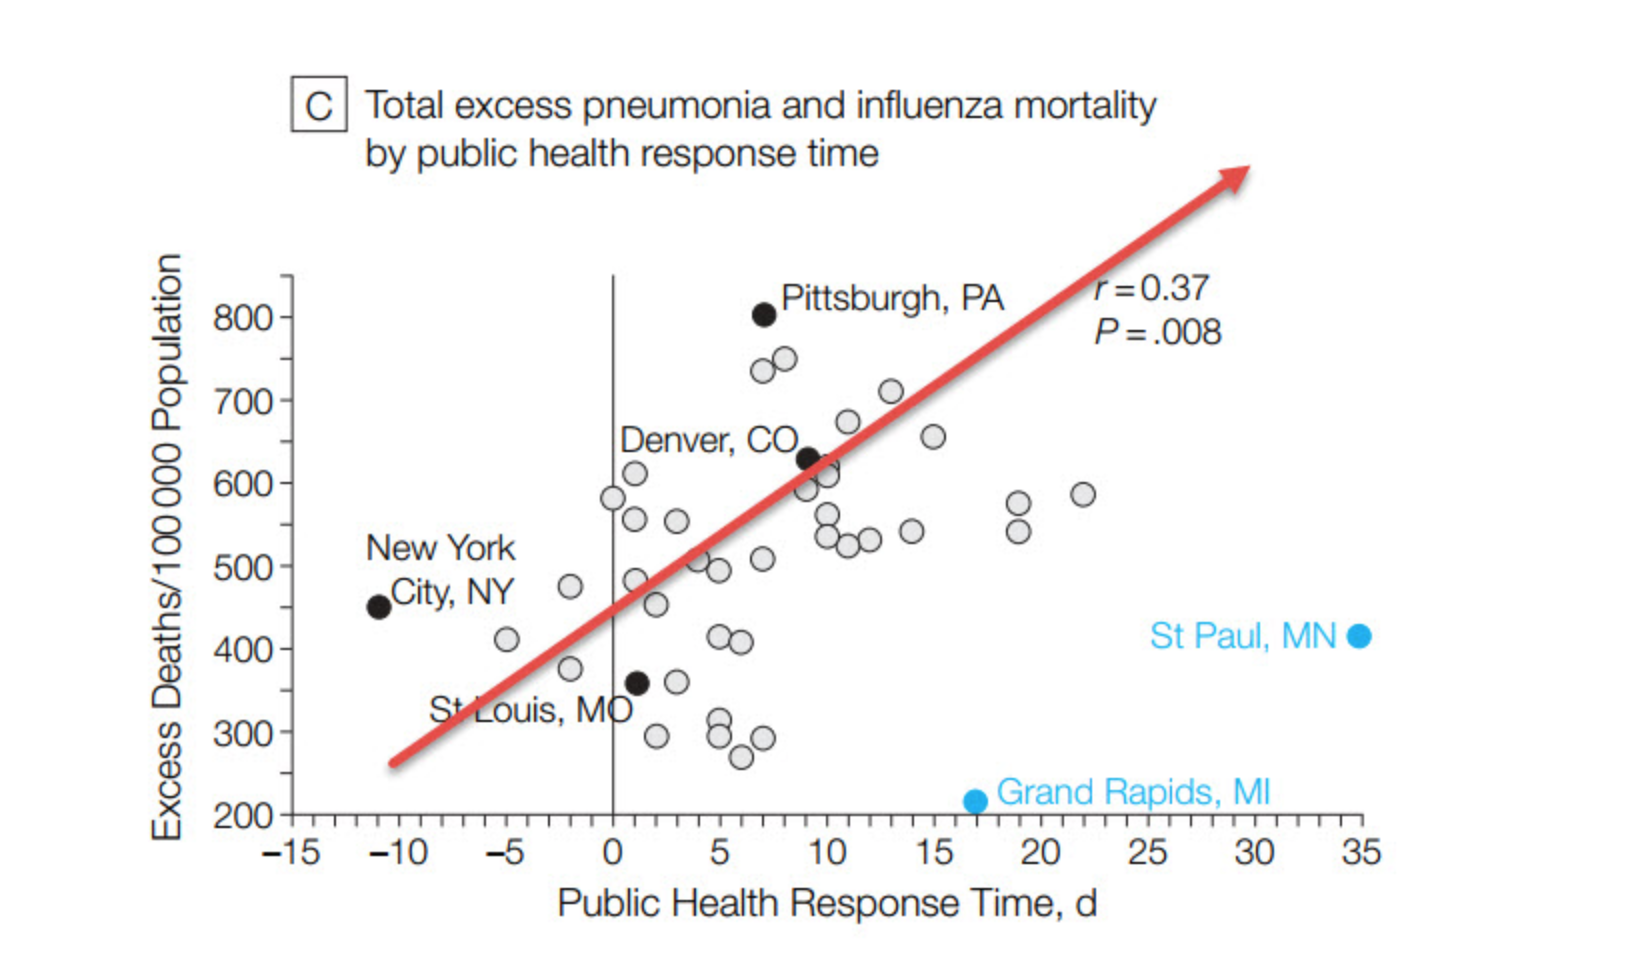
But there’s similar statistical evidence also available from earlier epidemics. An academic paper published in 2007 by Markel et al. compared the trajectory of the 1918-19 influenza epidemic in different cities of the United States, relating the trajectories to the methods of social control used to limit the epidemic, which were generally different from city to city. The following graph, for example, shows how the time to introduce social control measures affected the overall number of fatalities. Generally, the quicker the response time (d), the fewer the fatalities.
The following sets of graphs are also relevant in understanding how the timing and nature of social interventions impacted on the trajectory of the epidemic in 4 different cities (the ones marked with a solid black dot in the graph above). The curve shows the number of excess deaths per 100,000 of population as time progresses. The triangle in each case shows the date of the first identified case in that city. The horizontal bars beneath each graph show the periods in which each type of intervention was applied.
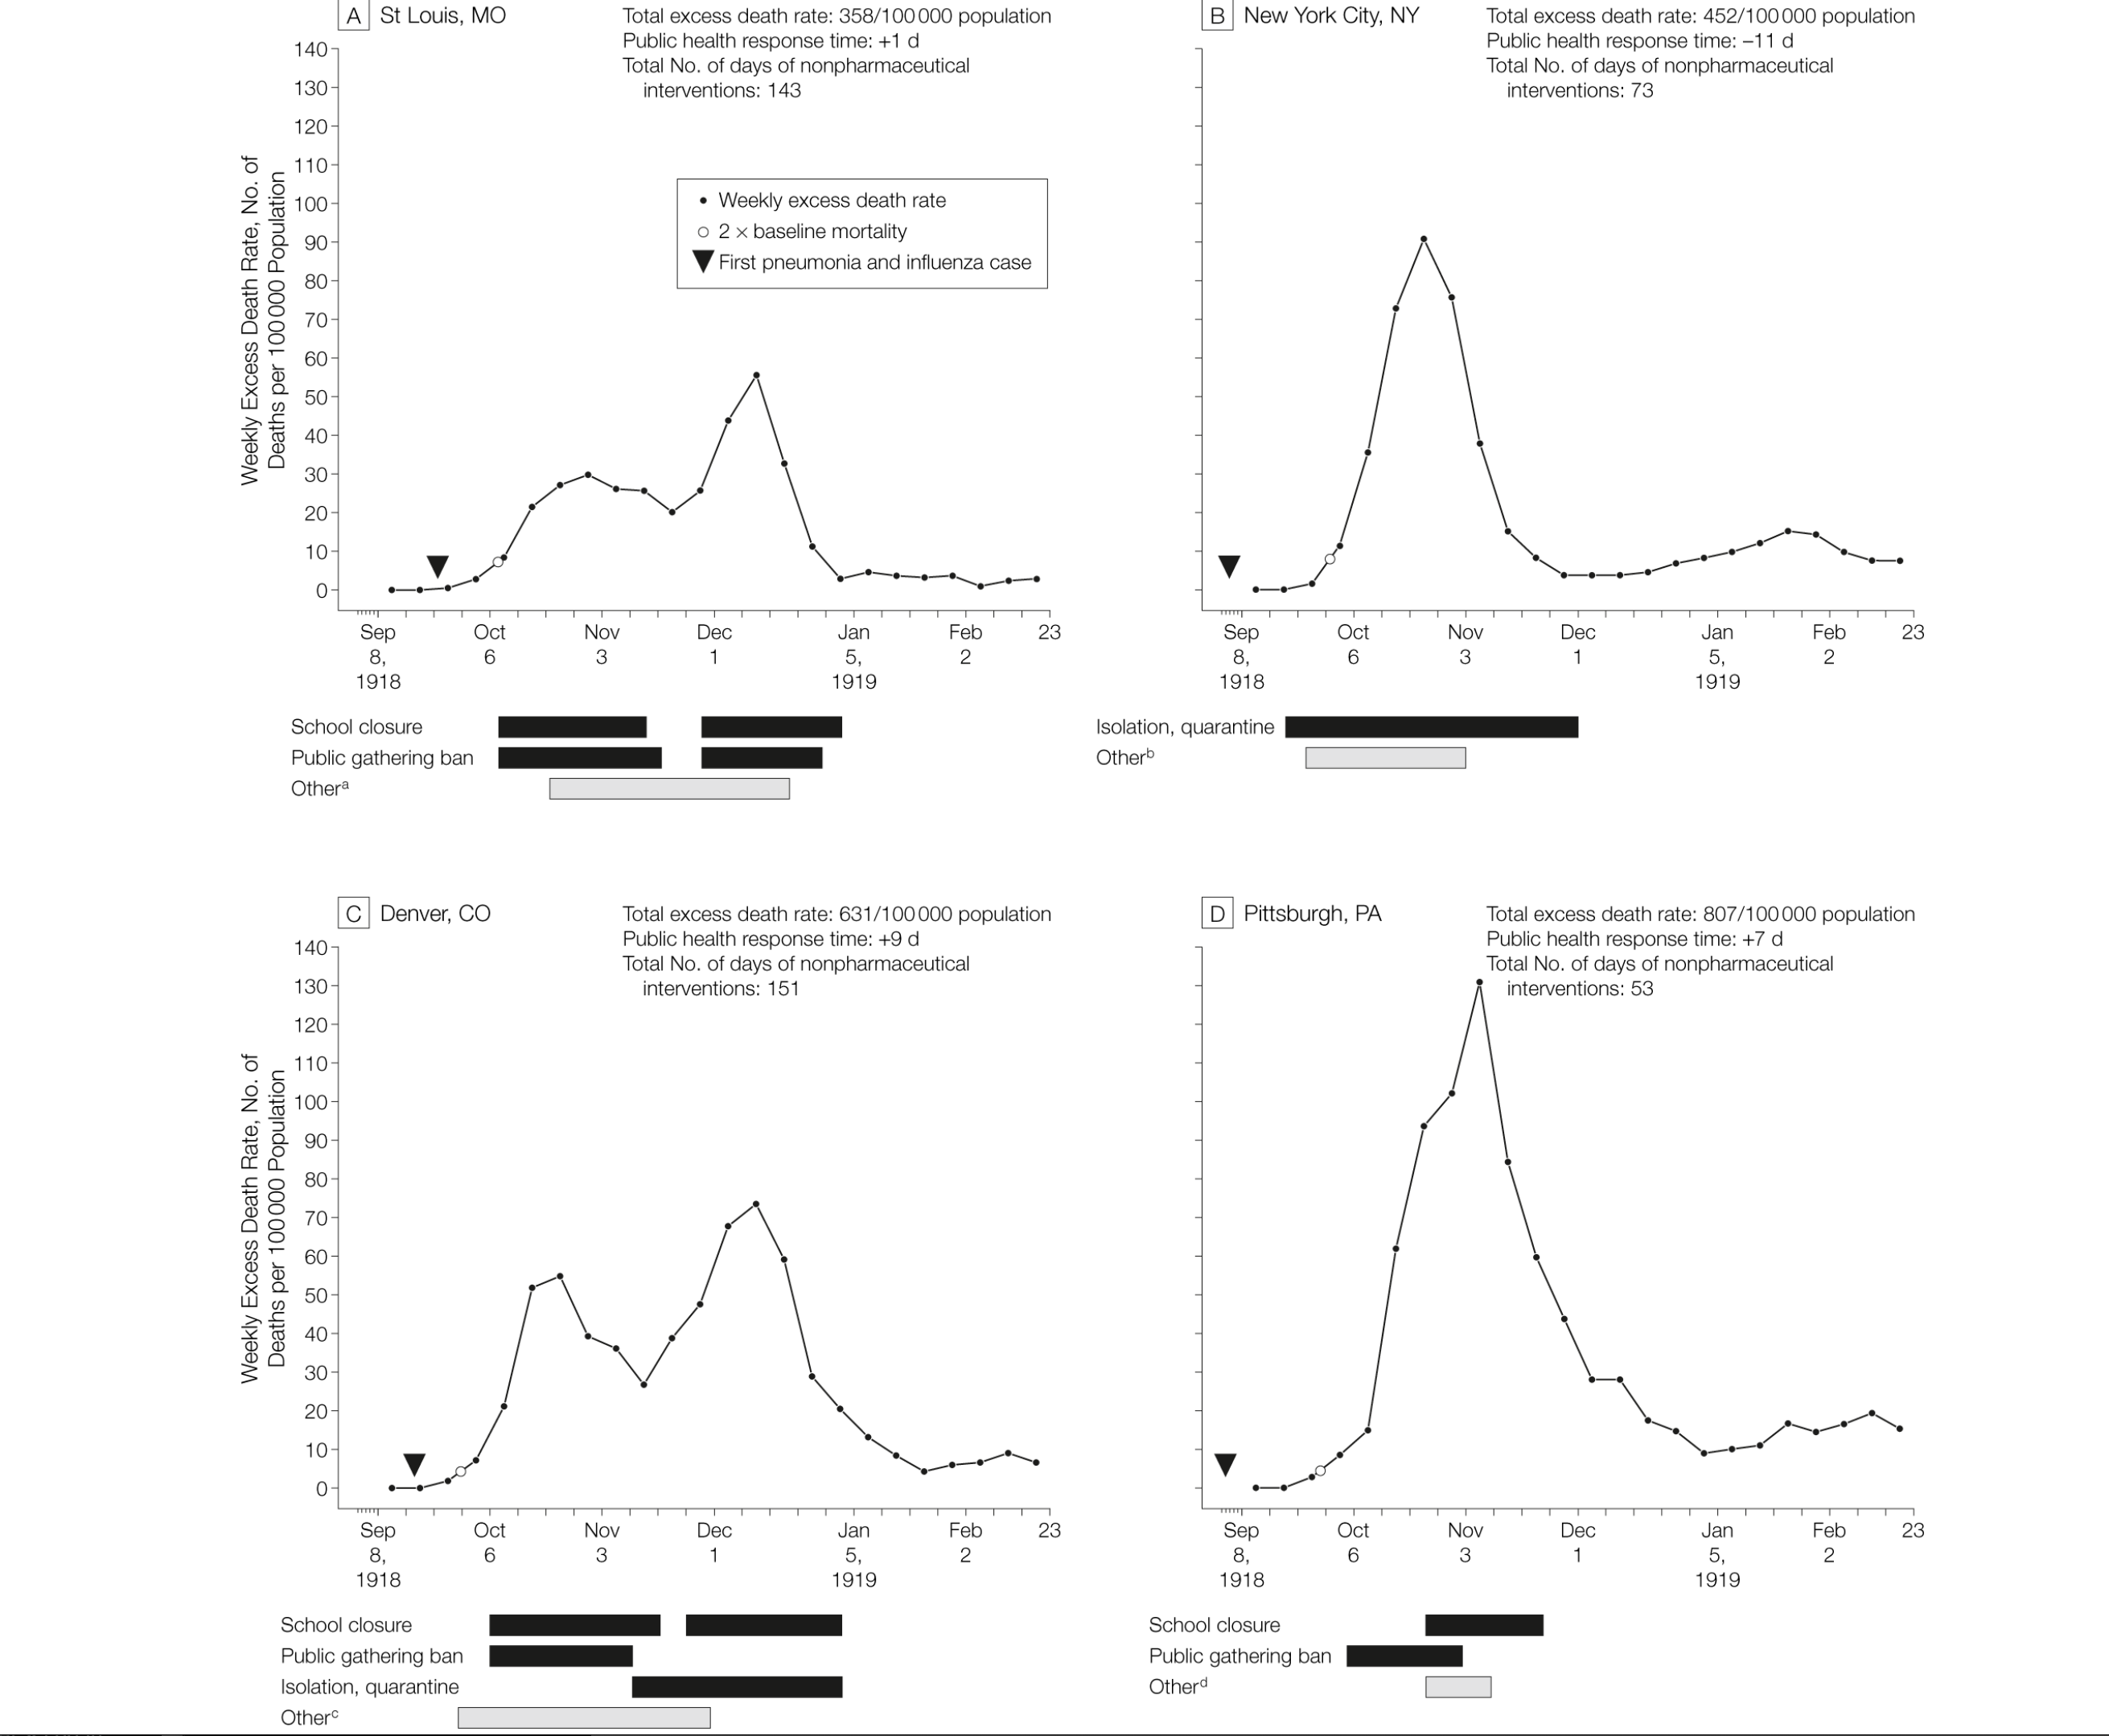
The main conclusions are:
- Each of the cities applied social restrictions of one sort or another, and each was successful in bringing the epidemic under control;
- St Louis and Denver relaxed some restrictions soon after an improvement in numbers, but then had a second peak and had to re-introduce them;
- New York chose not to close schools, but had a higher peak than St Louis and Denver. On the other hand, by not relaxing the restrictions that they did apply, they had only a very slight second peak.
- Denver and St Louis had quite similar strategies, but Denver’s were introduced later (see previous figure) and consequently had higher peaks and almost double the number of fatalities. This emphasises the importance of timing.
- Pittsburgh’s restrictions were more limited and introduced later. As a result, their peak and total number of excess fatalities was greater than the other cities, though they also avoided a second peak.
So, it’s not just about models. There is hard statistical evidence that social restrictions do work, and that fine tuning the timing and nature of interventions will have an effect on the trajectory of an epidemic. Of course, no two epidemics – or indeed countries – are identical, so what happened in the 1918-19 flu epidemic in the US won’t repeat identically for the current epidemic in the UK or Italy. But, the evidence is that social controls do work; that the type of controls applied can make a difference; and that timing is also critically important.
In summary, it might not always be easy to “stare a casa” – stay at home – but if everyone follows the rules of restriction, the effect on the course of the epidemic will be dramatic.
Though this post is based on the work by Markel et al., I also drew material from this summary article by Alex Tabarrok.
