Don’t make it bad
How good is Jude Bellingham?
No, really, how good is he?
Suppose you’d watched his games for England at Euro 2024 and had to make an assessment. He produced one moment of magic to rescue the Slovakia game; in spells he was one of England’s most creative midfield players; rather more often he struggled for space and to make any sort of meaningful impact.
The Scotsman, for example, gave Bellingham a tournament rating of 6 out of 10, saying:
Unplayable in the opening game against Serbia, his last minute bicycle kick in the last 16 was one of England’s most euphoric moments at Euro 2024. He will be back in future tournaments and is one of the world’s most talented players, but Bellingham didn’t live up to his pre-tournament hype in Germany.
But suppose you hadn’t watched the matches and only had the results to go on. Actually, suppose you’ve got the database of all England results with Bellingham in the team, not just the Euro games. That amounts to 36 matches, of which 22 were wins, 8 were draws and 6 were defeats. This implies a win ratio of 61%. On that basis you’d probably say Bellingham’s record is pretty good. For comparison, England’s long-term win ratio for all fixtures is 57%. But, digging deeper into the data, in 31 of England’s 36 games where Bellingham has played, Harry Kane was also playing; in 30 Declan Rice also played; and in 27 Phil Foden and John Stones played . So there’s very little information to separate the importance of Belligham’s contribution from that of several other England players and it would be very difficult from results alone to measure his strength.
But there are several reasons why it would be valuable to do so. If you were a football manager, you will want to know the value of a player if he’s already in your squad, or his potential value if you were thinking of buying him. And if you were a gambler, you would want to be able to judge the impact on likely match results according to whether any particular player was on the team sheet or not.
21 to 1
The Jude Bellingham discussion is really just a pretext to discuss the following video that Benoit kindly sent me:
The video describes a football competition called ’21 to 1′. The aim of the tournament was to take a group of 21 players and, via the results of a series of games played with these players, to identify the best player. The difficulty, just as with trying to measure Jude Bellingham’s ability, lies in distinguishing individual from team performance. And though the restriction to match results rather than other metrics of performance was artificial in the discussion above about Bellingham, it’s unavoidable here where the only data collected were match results.
The rules used in the tournament were as follows:
- The 21 players were randomly allocated in 3 teams of 7 players.
- The 3 teams would play a round-robin series, so that each team played both the others once.
- Points would be awarded in the usual way – 3 points for a win, 1 point for a draw.
- This process was repeated for a sequence of 4 rounds, with a fresh randomisation of teams for each round.
- In each round individual players would be awarded the number of points obtained by their current team. So if a team won two matches and drew one in a round, every player in that team would be awarded 7 points.
- Goals scored and conceded were also carried forward and assigned to each team member.
- The prize was awarded to the player who accumulated the highest number of points, with goal difference being used in the case of ties.
- If there was still a tie after taking goal difference into account, a coin flip was used to determine the winner. (Note: I made this rule up.)
The idea is that by mixing teams up and playing several rounds with different team compositions, it would be possible to identify the best player on the basis of the overall results. But how well does this method work?
Question 1: Will this process always lead to the best player winning the prize?
Clearly the answer to this question is no. The best player might, by chance, always end up in teams that are dominated by weaker players. But even if the best player is always in the best overall team, it’s possible that weaker teams get lucky and have better results, meaning that players other than the strongest players get a better overall score. Furthermore, the randomisation process could lead by chance to the strongest player being paired with another specific player in all 4 rounds. In this case those two players would have an identical score and have their scores separated on the basis of a coin flip, giving the weaker player an equal chance of being declared the winner.
This leads to:
Question 2: How good is this process at identifying the best player?
Answer: it depends.
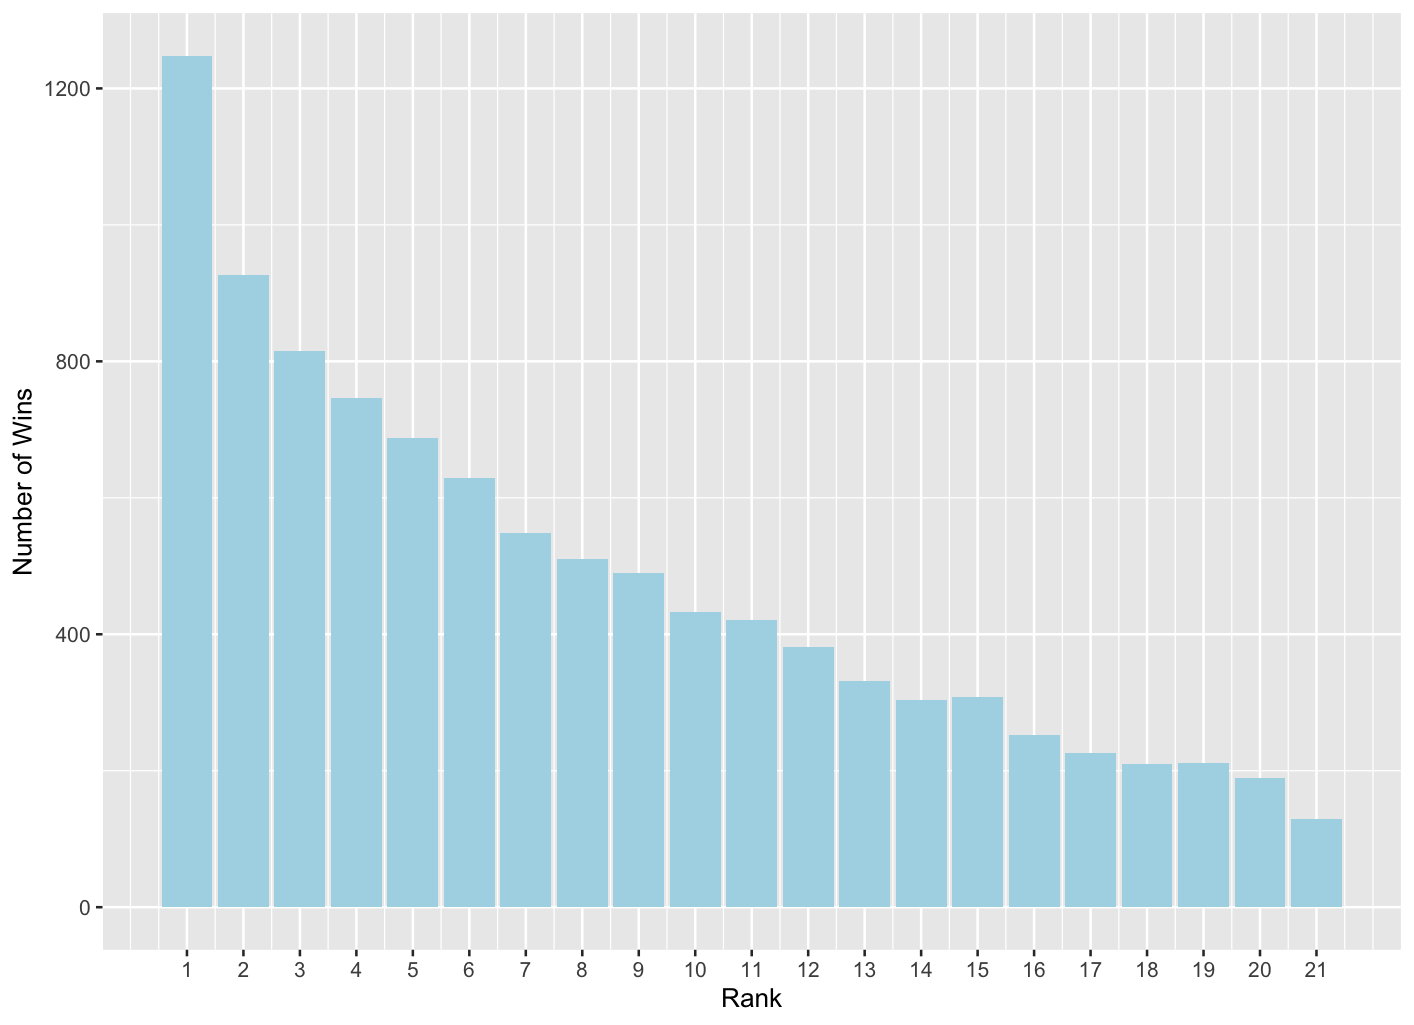
Figure 1: Number of wins by rank of player in 10,000 simulations of the 21 to 1 tournament
Figure 1 shows what happened in 10,000 simulations of the tournament. The x-axis corresponds to the rank of each player, and the y-axis shows on how many occasions that rank of player actually won the tournament. The strongest player is ranked 1; the weakest is ranked 21. This figure shows, therefore, that the strongest player actually won the tournament on around 1250, or around 12.5%, of the simulated tournaments. That means that on nearly 90% of occasions, someone other than the highest ranked player won the tournament. As you’d expect, the lower the rank of a player, the less often they win the tournament, but even the lowest ranked player won on 1.3% of occasions.
This suggests that the method isn’t very effective at identifying the best player. There’s a caveat, however: in running the simulations I had to make assumptions about player strengths, about the way the overall strength of a team depends on the individual player strengths and the way a result between two teams would depend on team strengths. My assumptions were:
- The overall team strength is the sum of the individual player strengths; and
- Team scores follow a Poisson distribution – a standard probability model in this context – with means that increase with team strength.
These assumptions are not dissimilar to standard assumptions for modelling football scores. But, there’s no unique way of determining player strengths, and the choices made in this regard will have an impact on the effectiveness of the tournament for identifying the strongest player.
For example, suppose all 21 players are very, very similar in their ability. This means that all teams will be of roughly similar strength, all matches could easily go either way and the tournament winner could equally likely be any one of the 21 players. On the other hand, if one player is very much stronger than the others, it’s likely that the teams he/she plays in will win, leading to a high probability that that player will win the tournament.
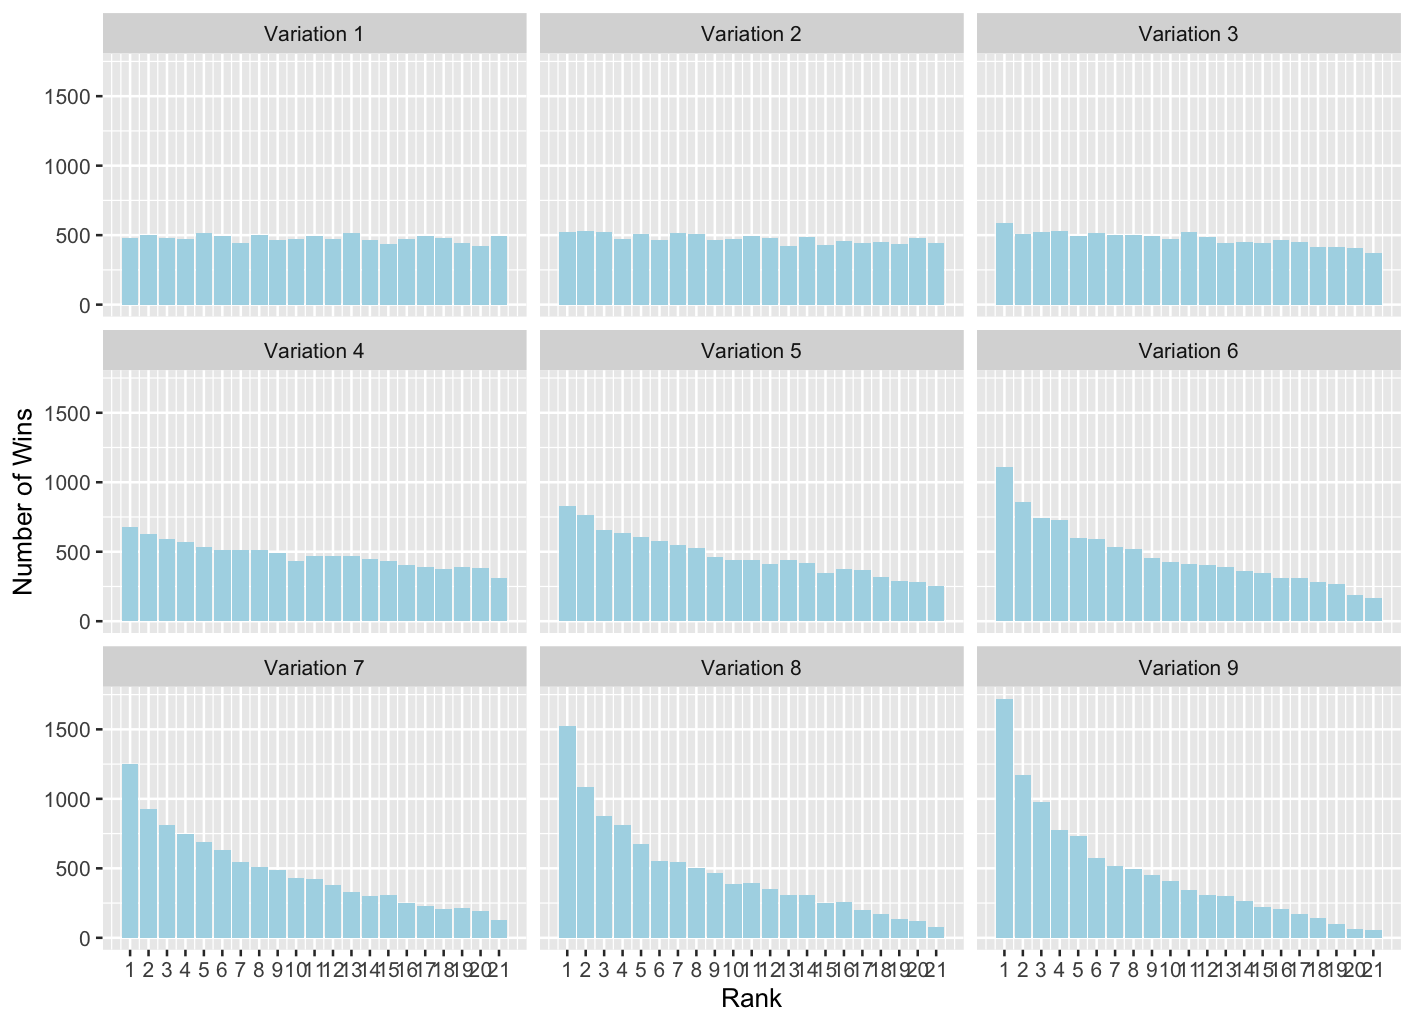
Figure 2: Repeat of Figure 1 showing Number of wins for each ranked player on 10,000 simulated repeats of the 21 to 1 tournament, with different degrees of variation between the players: Variation 1 corresponds to very little variation, increasing through to Variation 9, in which the variation is greatest
Figure 2 illustrates this phenomenon. It’s a repeat of Figure 1, but with increasing levels of variation in strength between the tournament players. In the panel labelled Variation 1, all players are very similar in strength. And the plot shows that in that case all ranks of player were equally likely to win the tournament. In other words, if there’s very little difference between any of the players, the tournament is just as likely to identify any of the players as strongest.
But as the variation between the players increases, so does the success of the tournament in identifying the strongest player. In the most extreme case, Variation 9, the best ranked player was correctly identified on around 17% of occasions. Had I assumed an even bigger degree of variation between the players, the probability of the tournament correctly identifying the best player would increase further.
In summary, the tournament scheme is only partially effective in identifying the best player in the tournament. And naturally, the greater the difference between the players, the more effective the tournament scheme is in identifying the best player. Without data, it’s impossible to know which version in Figure 2 comes closest to representing what actually happened in the video, though if we had match results we could estimate this aspect as well.
Finally…
Question 3: Can the tournament structure be modified to improve the chances of identifying the best player?
One very obvious way to increase the chances of identifying the best player would be to play more rounds in the tournament. This would have 2 effects: first, it would enable more mixing of individuals among teams, reducing the chance of two or more individuals always playing in the same team. And second, with more games, luck has more chance to ‘balance out’, so the information provided by the increased number of results will provide a better picture of the true strength of the teams playing in those matches.
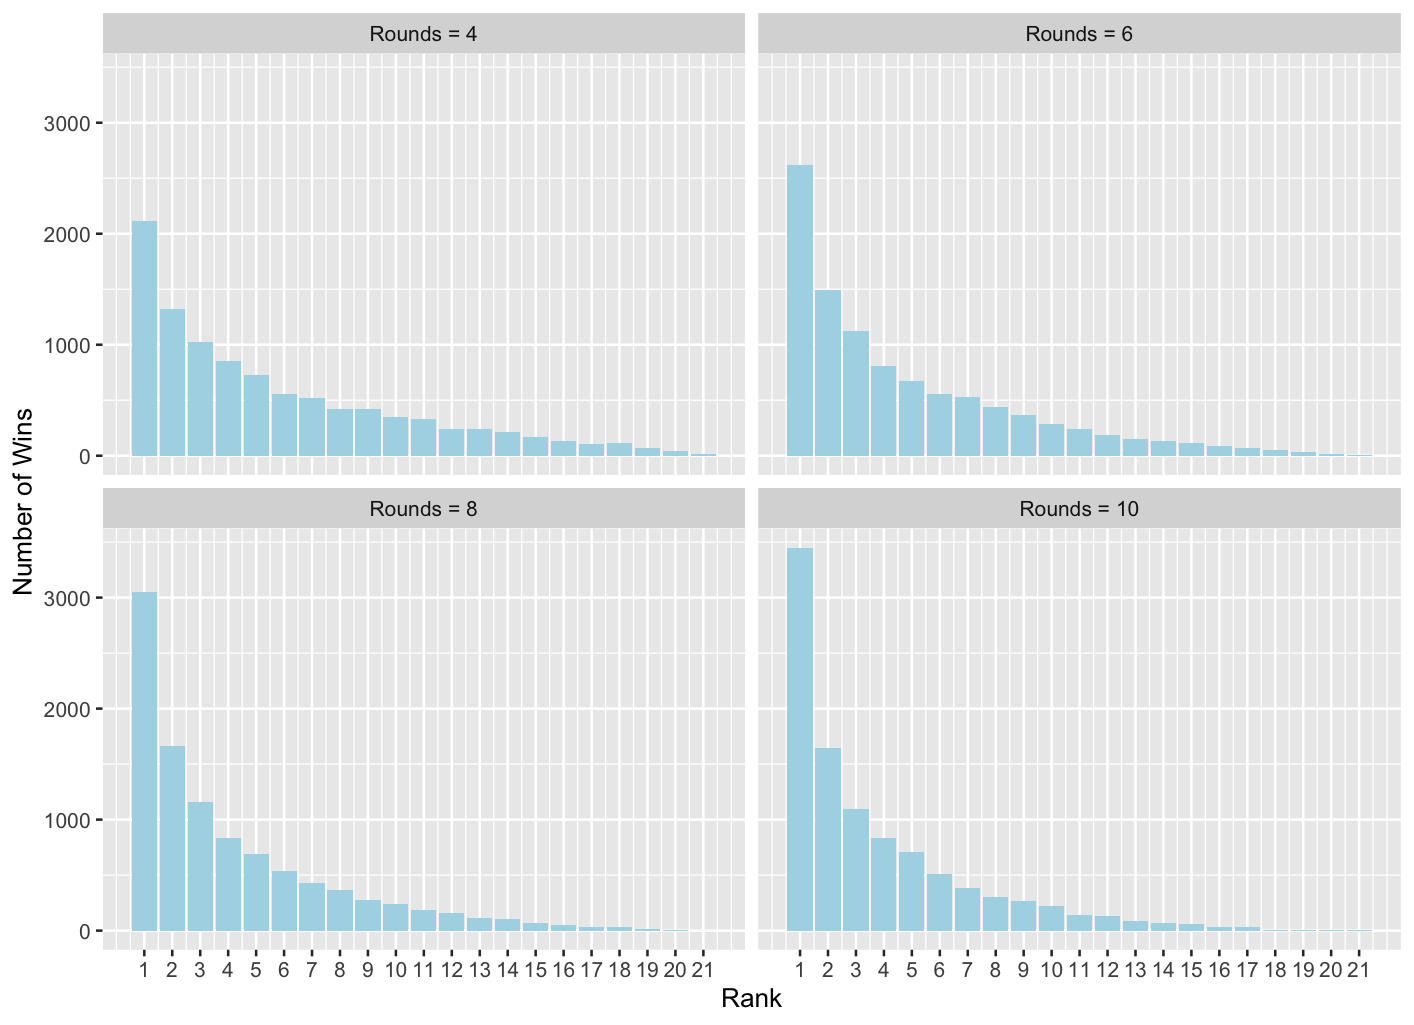
Figure 3: Simulated results from the 21 to 1 tournament as in previous figures, but now with different numbers of rounds played
Figure 3 is a repeat of Figure 1, but where the number of rounds simulated in the tournament is increased form 4 to 6, 8 and 10 respectively. As expected, the more rounds that are played, the more chance there is that the best ranked player wins the tournament.
An alternative method of improvement, at least in principle, would be to replace random selection of teams with a fixed selection which seeks to minimise the extent to which the same individuals are selected in the same team in separate rounds. It’s impossible to avoid all repetitions – in the second round, we have to place the 7 members of each team into 3 new teams, which means each team in the second round will have at least 3 players from one of the same first round teams – but with care the overlap over 4 rounds can be minimised.
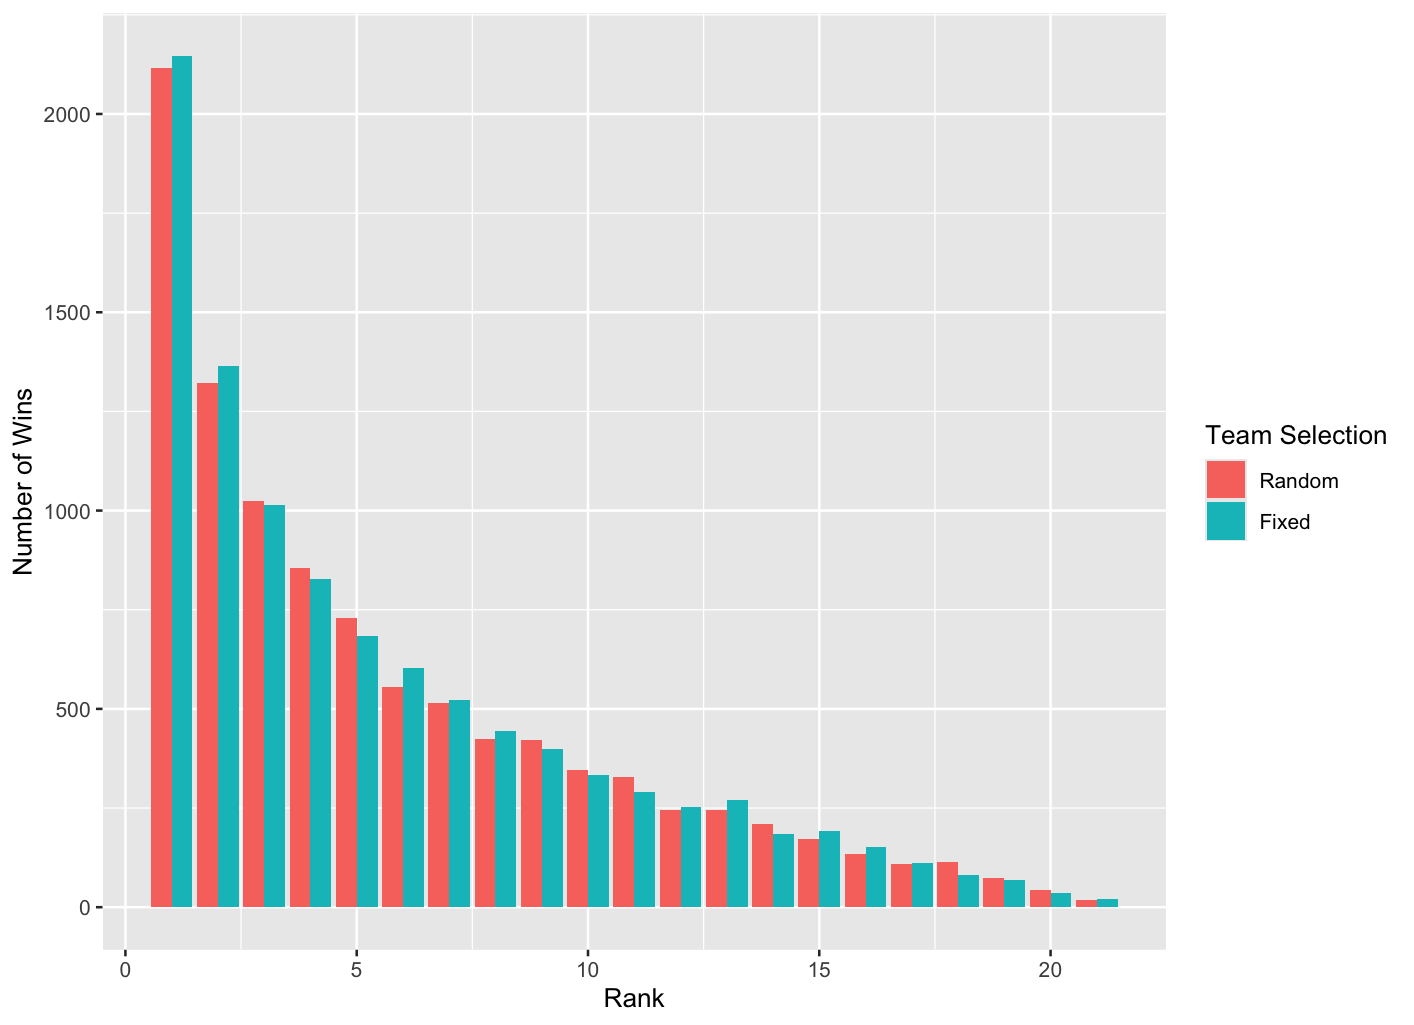
Figure 4: Like previous figures but comparing results when team selections are fixed to minimise repeat pairings rather than randomised
Figure 4 compares 10,000 simulated tournament results using either the randomised or fixed team selection methods. The differences are not massive, though there is some indication that the fixed method is picking up the best ranked player a little more often than the random method, and although it might be argued that this could just be due to randomness in the simulated data, repeating the exercise many times leads to results with a similar pattern.
Summary
The 21 to 1 tournament will, naturally, tend to identify the better players, but the extent to which it can pick out the very best will depend on how much variation there is between the participating players: the bigger the differences, the more chance there is that the tournament will identify the best player. But there will always be a chance that the tournament will be won by one of the weakest players. The chances of identifying the best player can be improved slightly by using designed team selection in place of randomisation, but considerably more by allowing further rounds of matches.
Postscript
Fabian, to whom I’m immensely grateful, has gone one step further than me and explored how the detailed aspects of a tournament like 21-to-1 determine the tournament’s efficiency to identify the best players. The results are a little more detailed than seems appropriate to report here, so I’ve placed them in a report available here.
