Here’s a weird thing: it’s likely that your friends have got, on average, more friends than you. But it’s not just you: even your friends’ friends are likely to have more friends, on average, than they do. In fact, everyone’s friends are likely to have more friends, on average, than they do.
How can that be?
We’ll come back to that. First… two questions. Try to answer each before reading on.
Question 1: You’re on holiday in a town that you’ve never visited before. It has a regular bus service, with buses that arrive every 30 minutes, but you don’t know the timetable. So you decide to take your chances and go to the bus stop at a random time and wait for the first bus to arrive. How long, on average, will you have to wait for the next bus?
|
|
|
|
|
|
|
|
|
|
|
|
|
|
|
Question 2: On average, in matches involving the team you support, there are 3 goals per game. Ignoring stoppage time, this means a goal is scored, on average, every 30 minutes. You’re busy one match day, so you just arrive at the game at some random time during the 90 minutes. On average, how long will you have to wait for a goal to be scored? (Ignore half time and stoppage time, and carry time over to the start of the next match if a goal isn’t scored. For example, if you arrive at the game on 75 minutes, there are no more goals in that game and the first goal in the next game occurs on 50 minutes, the time you’ll have waited is 15 minutes from the first game and 50 minutes from the second for a total of 65 minutes).
|
|
|
|
|
|
|
|
|
|
|
|
|
|
|
Answers: on average you’ll have to wait 15 minutes for a bus and 30 minutes for a goal.
But why is there a difference in these answers? In both cases the thing you are waiting for – a bus or a goal – occurs once every 30 minutes. But on average for a bus you only have to wait 15 minutes, while for a goal you have to wait 30 minutes.

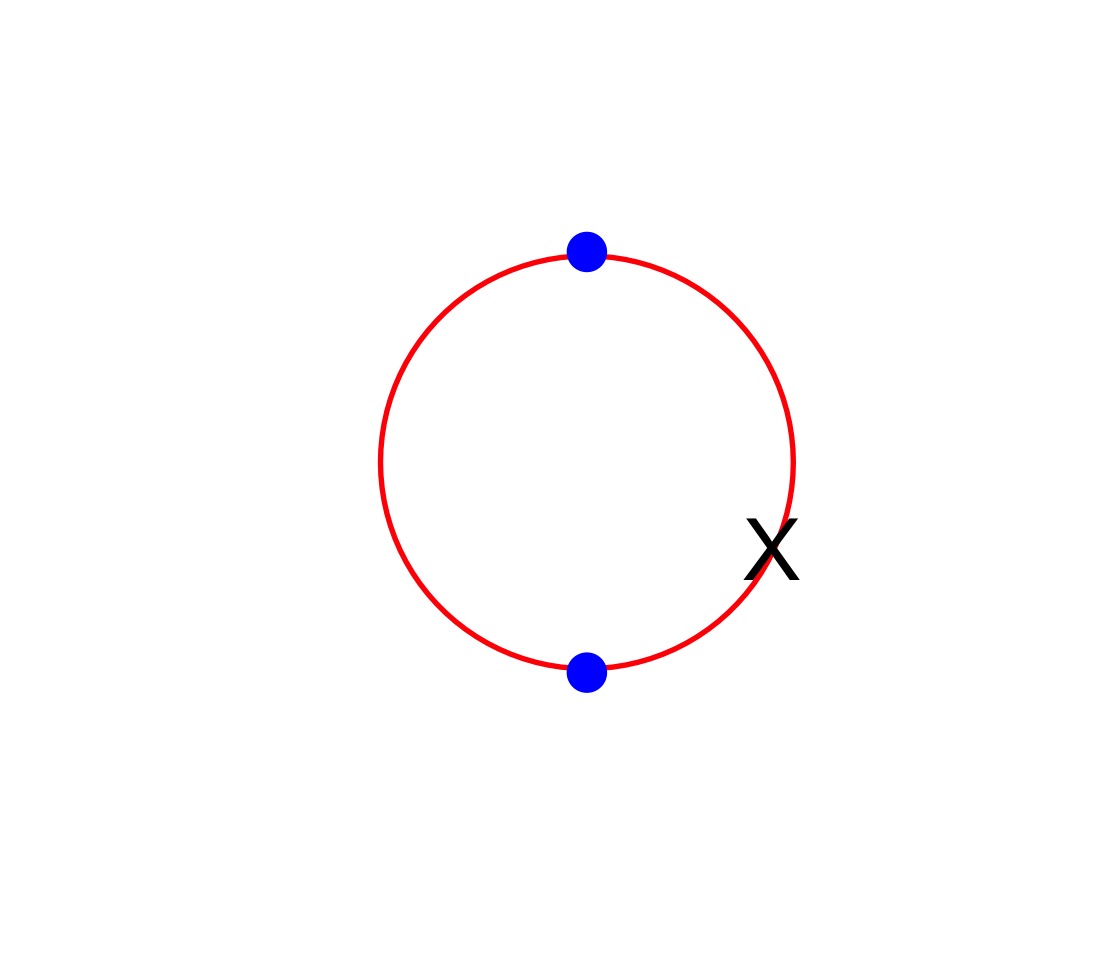
Figure 1: bus arrival times shown on a clock-face. Your random arrival time at bus stop is shown by X
Let’s consider the bus problem first. Figure 1 represents the situation on a clock face. Every half an hour a bus arrives, as represented by the blue dots. You arrive at some random point in the hour shown by the X. You’re equally likely to be on the left- or the right-hand side of the circle, and in either case the cross is randomly distributed on an interval of 30 minutes. This means your waiting time is evenly spread anywhere between 0 minutes and 30 minutes, which in turn, by symmetry, means you’ll have an average wait time of 15 minutes.
What’s different about goals in a football match is that even if they have the same average arrival rate as buses – one every 30 minutes – they don’t have the same regularity. It’s not perfectly accurate, but a reasonable working assumption for football matches is that goals occur randomly. That’s to say there’s no regularity to the times with which they occur and the occurrence of a goal or otherwise doesn’t depend at all on what’s already happened in the match.

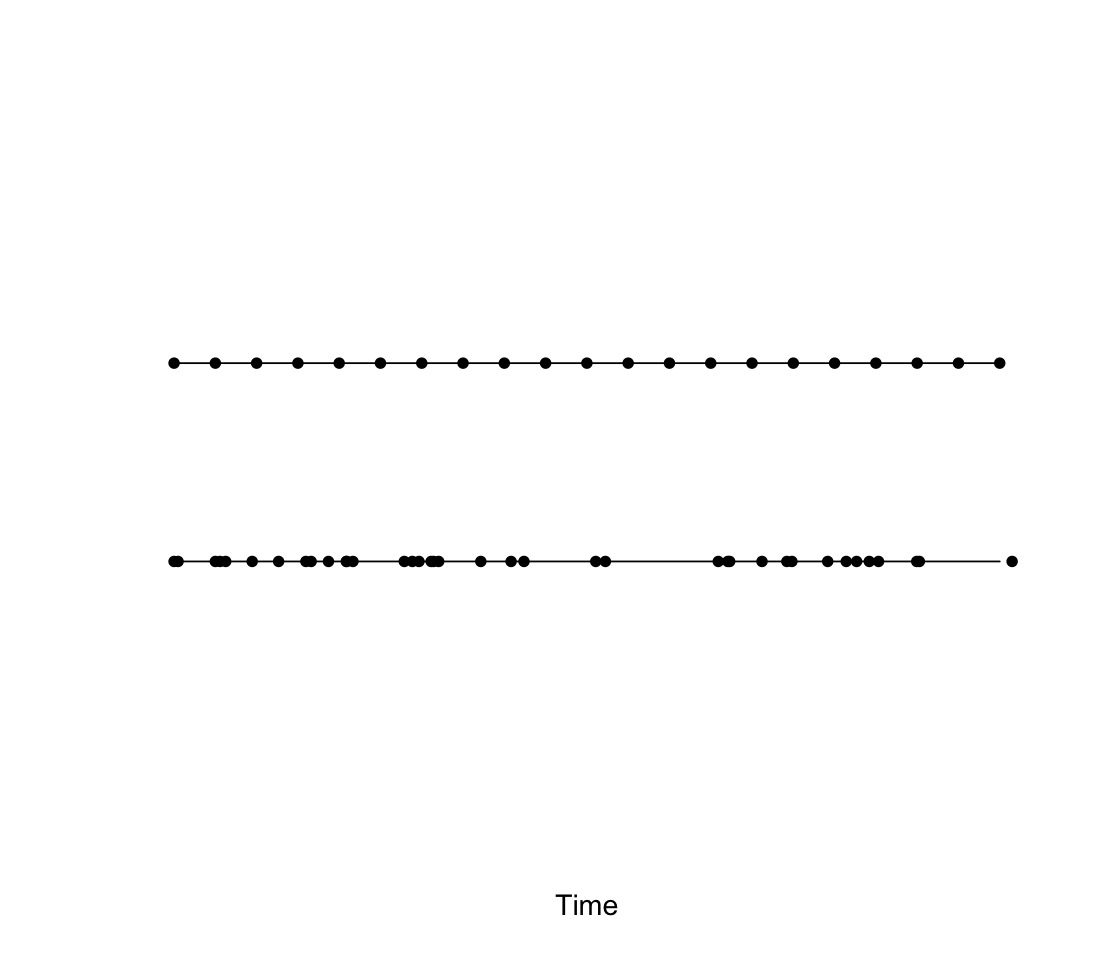
Figure 2: top row – arrival times of buses; bottom row – times of goals scored.
Figure 2 illustrates the difference in the two phenomena. The top part shows the regular arrival of buses through time; events in the bottom part, corresponding to goal times, have the same overall rate but the events have no regularity and the timing of events is independent of the previous history of events.
But here’s the thing: if the occurrence of goals doesn’t depend on what has previously happened in a game, then at any time at all, including whenever you arrive at the match, you will have to wait an average of 30 minutes for the next goal.
So it’s the difference in the regularity of the events – completely regular for buses, completely random for goals – that causes the expected waiting time to be different, even though the rate of occurrence of the events is the same in both cases.
The phenomenon that you have to wait 30 minutes and not 15 minutes for a goal, even though the average rate is one every 30 minutes, is called the waiting time paradox, though rather unhelpfully the waiting time for buses is often used to describe it. But buses are generally quite regular in their arrivals, and in that situation – as we’ve seen above – the paradox doesn’t arise. Goal times are a much more random process, so the waiting time paradox becomes relevant.
But there’s another consequence of this. As we’ve seen, when you arrive randomly at a match, you’ll have to wait an average of 30 minutes for the next goal. But by exactly the same argument, if you check when the previous goal occurred at the time you arrive, the average time will be 30 minutes. So, the average time between goals when you sit down at the match will be 60 minutes. This means that if you often arrive randomly at matches, and calculate the average time between the goals immediately preceding and following your arrival, that average will be around 60 minutes. Think about that: the average time between goals is 30 minutes, but the average time between the goals before and after you arrive randomly at matches is 60 minutes. It seems like a contradiction, but it’s not.
This way of looking at things is an example of a related phenomenon known as the inspection paradox. Because of the randomness in goal scoring, the interval between goals is sometimes short and sometimes long. If you turn up at the game at some random time, it’s more likely that you will arrive in a longer interval between goals than a short one. Look again at the lower part of Figure 2 – if you randomly add a cross somewhere, it’s more likely to fall in one of the longer gaps than the the shorter ones. The effect of this is that the gaps in goals preceding and following your random arrival is likely to be bigger than the average gap between goals. Which is what we already calculated: 60 minutes instead of 30 minutes.
This phenomenon, in turn, is a version of sampling bias. If you calculated the average time between goals over the many times you arrive at a match it would be 60 minutes. But this is a biased estimate of the true value which is 30 minutes. The bias has arisen because, as explained above, in the way you collect your sample you are more likely to observe long intervals than short ones, resulting in a biased estimate of the average time between goals.
We can now return to the issue of you and your friends and the fact that they’re likely to have more friends on average than you. This is called the friendship paradox, (^^) which is really another example of sampling bias.
The people you have as friends are more likely to be friendly people than unfriendly people. That’s why they became your friends. This means that if I average the number of friends they have it’s likely to be a bigger number than the number of friends you have. You’re just an average person. They’re not – they were selected from a population of people who are likely to be more friendly than average.
For example – the most extreme case – if I only sample your friendship circle, I won’t find anyone who has no friends at all, whereas in the wider population I presumably will. But even more generally, by selecting only your friends, I’ll be under-representing in my sample the people who tend to have fewer friends.
So, each of these things – the friendship paradox, the waiting time paradox, the inspection paradox – is linked to sampling bias. Last month’s post also explained how Sod’s Law – the tendency for things to go wrong if they can – is a likely result of sample bias.
And these are not just abstract problems. Collecting samples, analysing them and extrapolating to a wider population is the core of virtually every statistical analysis. Each of these paradoxes emphasises how careful we have to be in ensuring that our samples are genuinely representative of the population, how easy it is to get that wrong and how bad the results can be when we do.
^^ Honestly, you wait all day for a paradox, and then three turn up at once.
