This is a great story with a puzzle and an apparent contradiction at the heart of it, that you might like to think about yourself.
A couple of weeks ago Freddy wrote to me to say that he’d been looking at the recent post which discussed a probability puzzle based on coin tossing, and had come across something similar that he thought might be useful for the blog. Actually, the problem Freddy described was based on an algorithm for optimisation using genetic mutation techniques, that a friend had contacted him about.
To solve the problem, Freddy did four smart things:
- He first simplified the problem to make it easier to tackle, while still maintaining its core elements;
- He used intuition to predict what the solution would be;
- He supported his intuition with mathematical formalism;
- He did some simulations to verify that his intuition and mathematical reasoning were correct.
This is exactly how a statistician would approach both this problem and problems of greater complexity.
However… the pattern of results Freddy observed in the simulations contradicted what his intuition and mathematics had suggested would happen, and so he adjusted his beliefs accordingly. And then he wrote to me.
This is the version of the problem that Freddy had simplified from the original…
Suppose you start with a certain amount of money. For argument’s sake, let’s say it’s £100. You then play several rounds of a game. At each round the rules are as follows:
- You toss a fair coin (Heads and Tails each have probability 1/2).
- If the coin shows Heads, you lose a quarter of your current amount of money and end up with 3/4 of what you had at the start of the round.
- If the coin shows Tails, you win a quarter of your current amount of money and end up with 5/4 of what you had at the start of the round.
For example, suppose your first 3 tosses of the coin are Heads, Tails, Heads. The money you hold goes from £100, to £75 to £93.75 to £70.3125.
Now, suppose you play this game for a large number of rounds. Again, for argument’s sake, let’s say it’s 1000 rounds. How much money do you expect to have, on average, at the end of these 1000 rounds?
Have a think about this game yourself, and see what your own intuition suggests before scrolling down.
|
|
|
|
|
|
|
|
|
|
|
|
|
|
|
|
|
|
|
|
Freddy’s reasoning was as follows. In each round of the game I will lose or gain 25% of my current amount of money with equal probability. So, if I currently have £100, then at the end of the next round I will have either £75 or £125 with equal probability. And the average is still £100. This reasoning is true at each round of the game. And so, after any number of rounds, including 1000, I’d expect to have exactly the same amount of money as when I started: £100.
But when Freddy simulated the process, he found a different sort of behaviour. In each of his simulations, the money held after 1000 rounds was very close to zero, suggesting that the average is much smaller than £100.
I’ve taken the liberty of doing some simulations myself: the pattern of results in 16 repeats of the game, each time up to 1000 rounds, is shown in the following figure.
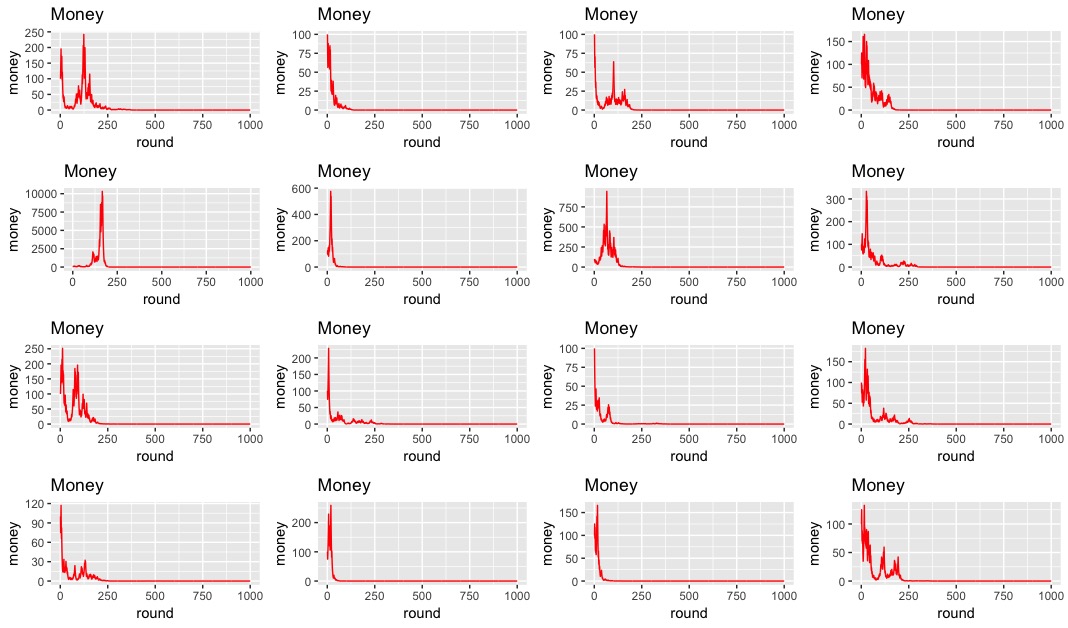
Each panel of the figure corresponds to a repeat of the game, and in each repeat I’ve plotted a red trace showing how much money I hold after each round of the game. In each case you can see that I start with £100, there’s then a bit of oscillation – more in some of the realisations than in others, due to random variation – but in all cases the amount of money I have hits something very close to zero somewhere before 250 rounds and then stays there right up to 1000 rounds.
So, there is indeed a conflict between Freddy’s intuition and the picture that these simulations provide.
What’s going on?
I’ll leave you to think about it for a while, and write with my own explanation and discussion of the problem in a future post. If you’d like to write to me to explain what you think is happening, I’d be very happy to hear from you.
Obviously, I’m especially grateful to Freddy for having sent me the problem in the first place, and for agreeing to let me write a post about it.
Update: if you’d like to run the simulation exercise yourself, just click the ‘run’ button in the following window. This will simulate the game for 1000 rounds, starting with £100. The graph will show you how much money you hold after each round of the game, while if you toggle to the console window it will tell you how much money you have after the 1000th round (to the nearest £0.01). This may not work in all browsers, but seems to work ok in Chrome. You can repeat the experiment simply by clicking ‘Run’ again. You’re likely to get a different graph each time because of the randomness in the simulations. But what about the final amount? Does that also change? And what does it suggest about Freddy’s reasoning that the average amount should stay equal to £100?
[datacamp_exercise lang=”r” height=”500″ min-height=”500″]
[datacamp_pre_exercise_code]
game_sim<-function(n_rounds=1000, money_start=100){
require(ggplot2)
money<-c()
money[1]<-money_start
for(i in 2:(n_rounds)){
money[i]<-money[i-1]*sample(c(.75,1.25),1)
}
m<-data.frame(round=1:n_rounds,money=money)
cat(‘Money in pounds after ‘,n_rounds, ‘ rounds is ‘,round(money[n_rounds],2))
ggplot(aes(x=round,y=money),data=m)+geom_line(color=’red’)+
ggtitle(‘Money’)
}
[/datacamp_pre_exercise_code]
[datacamp_sample_code]
game_sim()
[/datacamp_sample_code]
[datacamp_solution]
[/datacamp_solution]
[datacamp_sct]
[/datacamp_sct]
[datacamp_hint]
[/datacamp_hint]
[/datacamp_exercise]
