If you follow basketball you’re likely to know that the NBA draft was held this weekend, resulting in wonderkid Zion Williamson being selected for New Orleans Pelicans. The draft system is a procedure by which newly available players are distributed among the various NBA teams.
Unlike most team sports at professional level in Europe, the draft system is a partial attempt to balance out teams in terms of the quality of their players. Specifically, teams that do worse one season are given preference when choosing players for the next season. It’s a slightly archaic and complicated procedure – which is shorthand for saying I couldn’t understand all the details from Wikipedia – but the principles are simple enough.
There are 3 stages to the procedure:
- A draft lottery schedule, in which teams are given a probability of having first pick, second pick and so on, based on their league position in the previous season. Only teams below a certain level in the league are permitted to have the first pick, and the probabilities allocated to each team are inversely related to their league position. In particular, the lowest placed teams have the highest probability of getting first pick.
- The draft lottery itself, held towards the end of May, where the order of pick selections are assigned randomly to the teams according to the probabilities assigned in the schedule.
- The draft selection, held in June, where teams make their picks in the order that they’ve been allocated in the lottery procedure.
In the 2019 draft lottery, the first pick probabilities were assigned as follows:
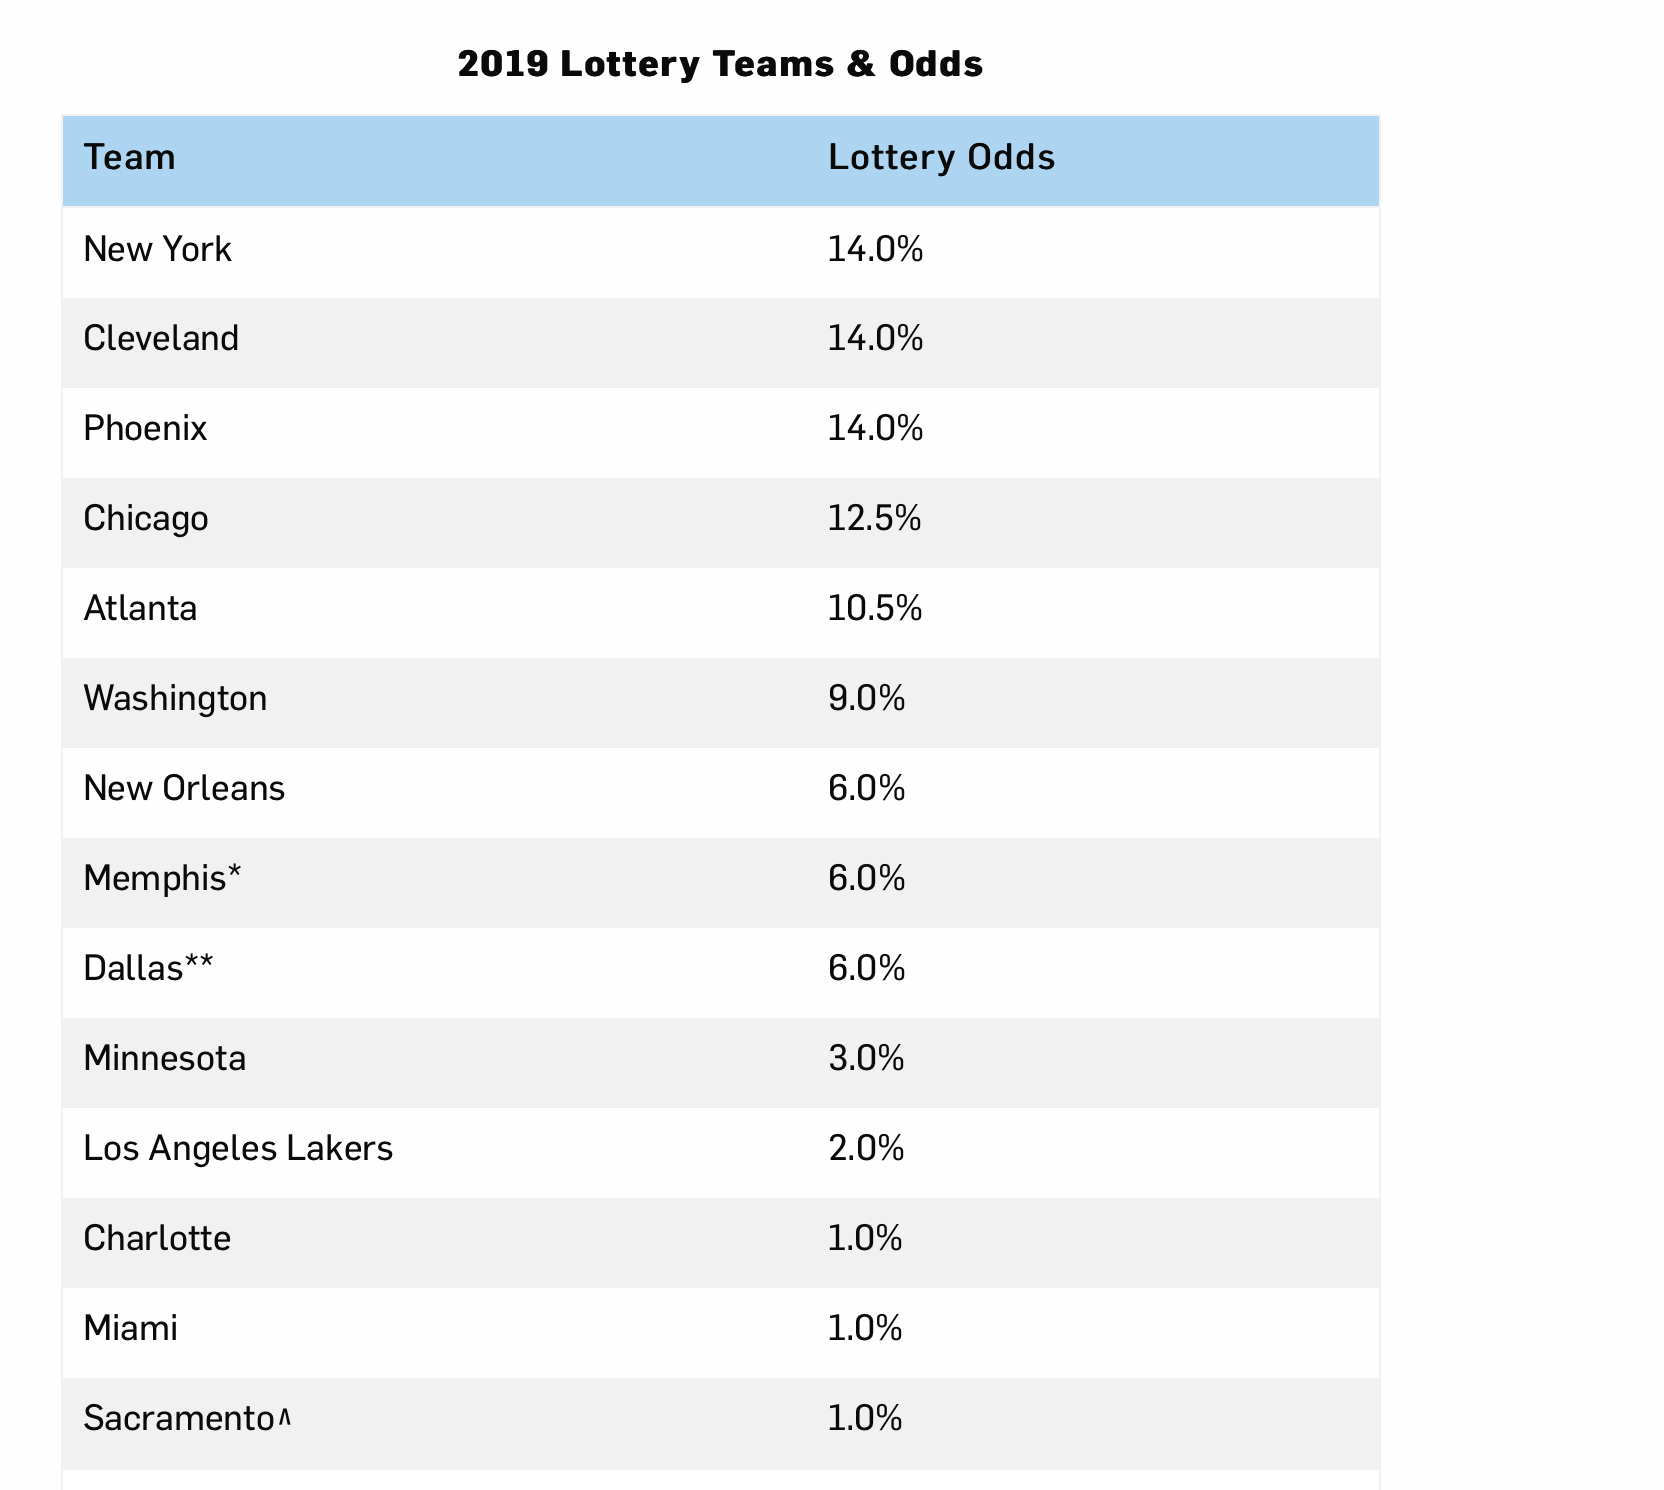
So, the lowest-placed teams, New York, Cleveland and Phoenix, were all given a 14% chance, down to Charlotte, Miami and Sacramento who were given a 1% chance. The stars and other indicators in the table are an additional complication arising from the fact that teams can trade their place in the draw from one season to another.
In the event, following the lottery based on these probabilities, the first three picks were given to New Orleans, Memphis and New York respectively. The final stage in the process was then carried out this weekend, resulting in the anticipated selection of Zion Williamson by the New Orleans Pelicans.
There are several interesting aspects to this whole process from a statistical point of view.
The first concerns the physical aspects of the draft lottery. Here’s an extract from the NBA’s own description of the procedure:
Fourteen ping-pong balls numbered 1 through 14 will be placed in a lottery machine. There are 1,001 possible combinations when four balls are drawn out of 14, without regard to their order of selection. Before the lottery, 1,000 of those 1,001 combinations will be assigned to the 14 participating lottery teams. The lottery machine is manufactured by the Smart Play Company, a leading manufacturer of state lottery machines throughout the United States. Smart Play also weighs, measures and certifies the ping-pong balls before the drawing.
The drawing process occurs in the following manner: All 14 balls are placed in the lottery machine and they are mixed for 20 seconds, and then the first ball is removed. The remaining balls are mixed in the lottery machine for another 10 seconds, and then the second ball is drawn. There is a 10-second mix, and then the third ball is drawn. There is a 10-second mix, and then the fourth ball is drawn. The team that has been assigned that combination will receive the No. 1 pick. The same process is repeated with the same ping-pong balls and lottery machine for the second through fourth picks.
If the same team comes up more than once, the result is discarded and another four-ball combination is selected. Also, if the one unassigned combination is drawn, the result is discarded and the balls are drawn again. The length of time the balls are mixed is monitored by a timekeeper who faces away from the machine and signals the machine operator after the appropriate amount of time has elapsed.
You probably don’t need me to explain how complicated this all is, compared to the two lines of code it would take to instruct the same procedure electronically. Arguably, perhaps, seeing the lottery carried out with the physical presence of ping pong balls might stop people thinking the results had been fixed. Except it doesn’t. So, it’s all just for show. Why do things efficiently and electronically when you can add razzmatazz and generate high tv ratings? Watching a statistician generate the same ratings for a couple of minutes on a laptop maybe just wouldn’t have the same appeal.
Anyway, my real reason for including this topic in the blog is the following. In several previous posts I’ve mentioned the use of simulation as a statistical technique. Applications are varied, but in most cases simulation is used to generate many realisations from a probability model in order to get a picture of what real data are likely to look like if their random characteristics are somehow linked to that probability model.
For example, in this post I simulated how many packs of Panini stickers would be needed to fill an album. Calculating the probabilities of the number of packs needed to complete an album is difficult, but the simulation of the process of completing an album is easy.
And in a couple of recent posts (here and here) we used simulation techniques to verify what seemed like an easy intuitive result. As it turned out, the simulated results were different from what the theory suggested, and a slightly deeper study of the problem showed that some care was needed in the way the data wee simulated. But nonetheless, the principle of using simulations to investigate the expected outcomes of a random experiment were sound. In each case simulations were used to generate data from a process whose probabilities would have been practically impossible to calculate by other means.
Which brings me to this article, sent to me by Ollie. On the day of the draft lottery, the masterminds at USA Today decided to run 100 simulations of the draft lottery to see which team would get the first pick. It’s mind-numbingly pointless. As Ollie brilliantly put it:
You have to admire the way they’ve based an article on taking a known chance of something happening and using just 100 simulations to generate a less reliable figure than the one they started with.
In case you’re interested, and can’t be bothered with the article, Chicago got selected for first pick most often – 19 times – in the 100 USA Today simulations, and were therefore ‘predicted’ to win the lottery. But if they’d run their simulations much more often, it’s 100% guaranteed that Chicago wouldn’t have won, but would have been allocated first pick close to the 12.5% of occasions corresponding to their probability in the table above. With enough simulations, the simulated game would always be won by one of New York, Cleveland or Phoenix, whose proportions would only be separated by small amounts due to random variation.
The only positive thing you can say about the USA Today article, is that at least they had the good sense not to do the simulation with 14 actual ping pong balls. As they say themselves:
So to celebrate one of the most cruel and unusual days in sports, we ran tankathon.com’s NBA draft lottery simulator 100 times to predict how tonight will play out. There’s no science behind this. We literally hit “sim lottery” 100 times and wrote down the results.
I especially like the “there’s no science behind this” bit. Meantime, if you want to create your own approximation to a known set of probabilities, you too can hit the “sim lottery” button 100 times here.
Update: Benoit pointed me at this article, which is relevant for two reasons. First, in terms of content. In previous versions of the lottery system, there was a stronger incentive in terms of probability assignments for teams to do badly in the league. This led to teams ‘tanking’: deliberately throwing games towards the end of a season when they knew they were unlikely to reach the playoffs, thereby improving their chances of getting a better player in the draft for the following season. The 2019 version of the lottery aims to reduce this effect, by giving teams less of an incentive to be particularly poor. For example, the lowest three teams in the league now share the highest probability of first pick in the draft, whereas previously the lowest team had a higher probability than all others. But the article Benoit sent me suggests that the changes are unlikely to have much of an impact. It concludes:
…it seems that teams that want to tank still have strong incentives to tank, even if the restructured NBA draft lottery makes it less likely for them to receive the best picks.
The other reason why this article is relevant is that it makes much more intelligent use of simulation as a technique than the USA Today article referred to above.
