Many of you will know that my involvement with Smartodds stems from co-authorship of an academic paper with Mark Dixon. In this paper we developed a statistical model for calculating probabilities of football match results. Since then I’ve sometimes been asked – and indeed, was asked at a previous Smartodds offsite meeting – whether I regretted publishing that paper, rather than simply using its methodology to try to make money from bookmakers.
There are several answers to that question, including:
- Mark was really the principal author for that work, and so it was mostly his choice what we did with it;
- At the time I was genuinely more interested in the academic side of the work, rather than any potential it had for generating money;
- The model alone was, at best, only marginally profitable. Without additional knowledge from football experts, it was unlikely to make money;
- If we hadn’t published the paper, I’d probably have never ended up being connected to Smartodds.
Anyway, I recently thought about all this while following the Guardian coverage of England’s cricket World Cup semi-final, which mentioned that at that stage of the game – sometime in England’s innings after New Zealand had set a target of – CricViz were giving England a 79% chance of winning. I’d never heard of CricViz, so I followed the links and discovered that it’s fundamentally an in-running cricket model that sits on your phone. You can get a complete description and links to download for Android or IOS here.
In terms of interface, CricViz is light years ahead of the work on football that I published with Mark Dixon. If you’d wanted to make predictions for football matches having read our original paper, you’d have had to collect data, program the model and run the predictions yourself. CricViz gives you live predictions for important matches both before the match starts, and over-by-over as the match progresses. It’s brilliant. And so, a similar question might be put to the authors of CricViz: why give this tool away for free, instead of using the methodology to fleece the bookmakers?
There are probably multiple answers to this question too, but one central issue is obviously the quality of the model on which CricViz is based. Though my paper with Mark Dixon didn’t make it easy for readers to calculate match numbers for themselves, it did provide both a complete mathematical recipe for what was needed as well as an analysis of historical results demonstrating its potential. CricViz does neither of those things. Its home website simply states…
WinViz is built upon CricViz’s proprietary model of T20 cricket. This model takes the career records of the players involved, historical data from the venue and country where the match is played, and the current match situation. the model then computes the probability of each result.
So, although you can launch WinViz on your phone to generate numbers live as a match progresses, the details of how those numbers are calculated are sketchy. Let’s make some guesses though…
A complicating feature of cricket is that there are different factors that contribute to the strength of a team’s position during a game, including:
- The number of runs the other team has already scored, where appropriate;
- The number of runs the batting team has scored so far in the innings;
- The number of wickets for the batting team that have already been lost;
- The number of balls remaining in the innings.
And all of this is before taking account of the actual strength of the two teams.
But we’ve discussed this issue in an earlier post – here – and it also got a mention here. In summary, a team’s remaining strength in an innings can be considered to be a function of the resources still available to them, as measured by balls and wickets. And in a landmark study, Duckworth and Lewis developed a formula which maps available resources into expected runs. Their objective was to develop a method that would provide a fair target for teams when matches were reduced by bad weather, leading to different numbers of balls received by each team. But, the Duckworth-Lewis formula works equally well as a baseline method for in-running match predictions in matches without weather restrictions. And it’s likely that when the authors of CricViz say their model takes into account ‘current match situation’, this is precisely what they mean and how they do it.
The rest is more vague though. The career history of the players involved is taken into account, as is the history of previous matches in the same stadium and country. This suggests some kind of regression modelling that takes account of these aspects, but it’s not clear whether this applies to the Duckworth-Lewis adjustment itself or to the baseline deadball numbers to which the Duckworth-Lewis adjustment is applied.
For example: the deadball estimate for the number of runs scored in a complete innings by a particular team might be 300. After they have scored 100 runs it might be that Duckworth-Lewis calculations lead to the assessment that they have used 25% of their resources for that innings. In which case, they would be predicted to score a further 75% of 300 on top of the 100 they have already scored, for a total of 325. And the WinViz model might imply adjustments to the 300 or to the 75% or both, depending on the team composition and the history of matches in that particular stadium and country.
But how well does WinViz perform? It’s actually very difficult to tell, since – perhaps to avoid scrutiny – the CricViz app includes a history section of recent matches only. For example, when writing this blog post soon after the World Cup, all World Cup matches were available, but they’ve now been deleted. So, it’s not possible to do any kind of serious diagnostic analysis of model performance, though a ‘sanity-check’ can be done on any of the games currently available in the history.
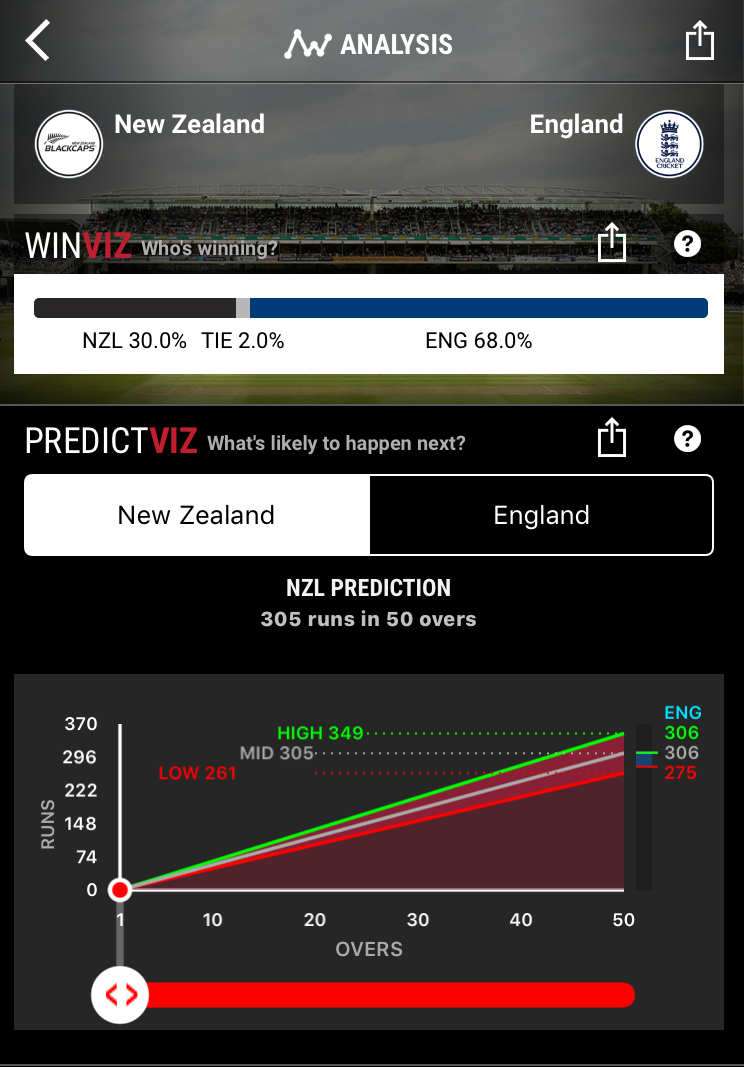
For example, here’s the story of England’s world cup final victory against New Zealand as told by WinViz at different stages go the match. Each of the figures is a screenshot of the CricViz iPhone app at the relevant stage in the match. The main features of each figure are predicted match outcome probabilities given current score and a graph showing the way the batting team’s score has increased throughout the innings so far, and how it’s predicted to increase over the rest of the innings.
- New Zealand are to bat first and are predicted to score 305. With 50% probability their score is expected to fall in the interval (261, 349). England are expected to beat New Zealand’s score with probability 68%. The tie has just a 2% prediction probability.
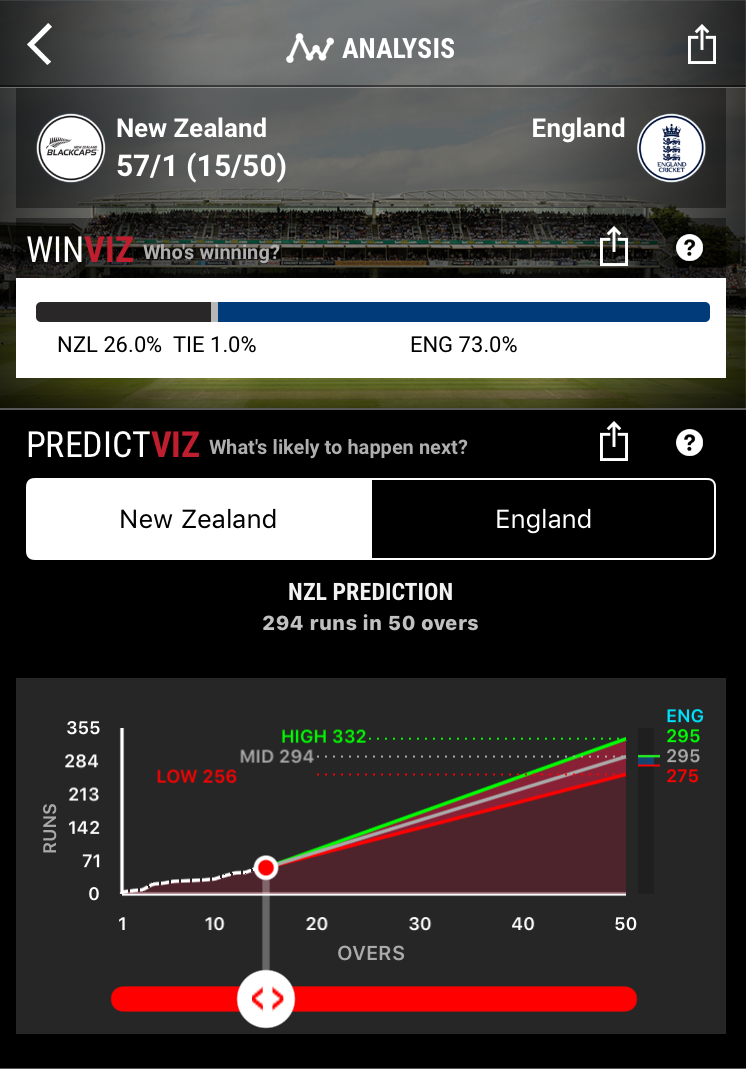
2. After 15 overs, New Zealand have made a steady start in that the’ve only lost a single wicket. however, their scoring rate is quite low, so the England win probability has gone up slightly to 73%.
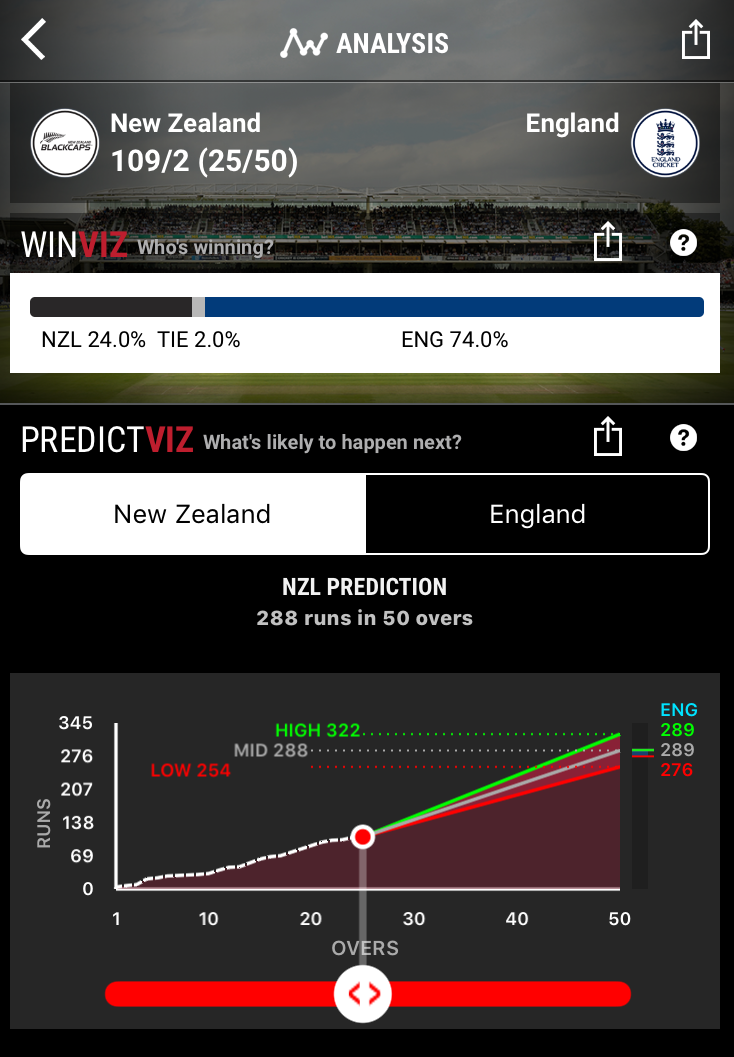
3. After 25 overs, New Zealand have kept the run rate ticking over, and have lost just one further wicket. England’s win probability remains pretty much unchanged.
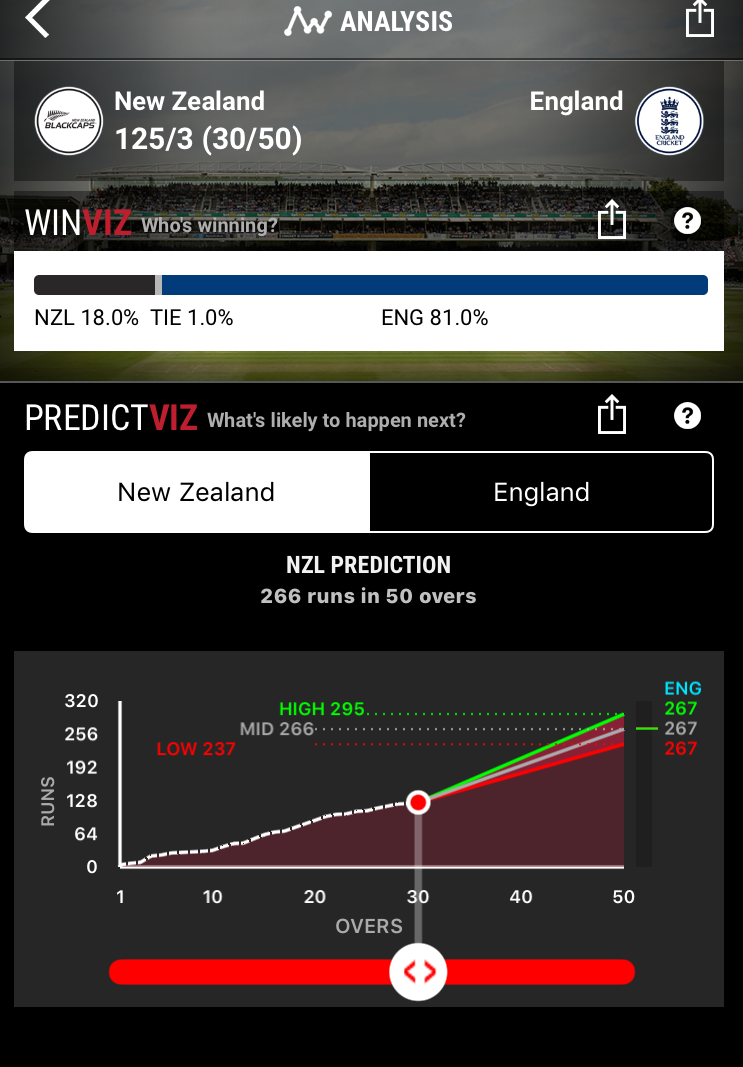
4. After 30 overs New Zealand’s run rate has slowed a little and they’ve lost a further wicket. England’s win probability increases further to 81%.
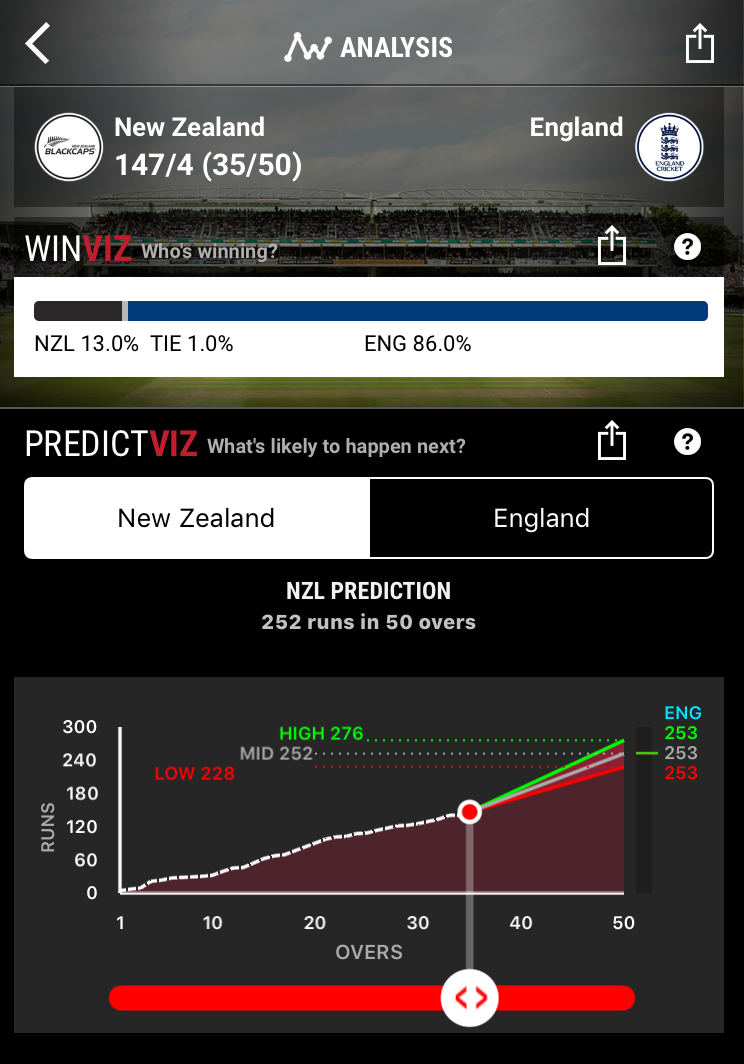
5. On 35 overs New Zealand are still scoring at a slowish rate and have lost a fourth wicket. England now have an 86% win probability.
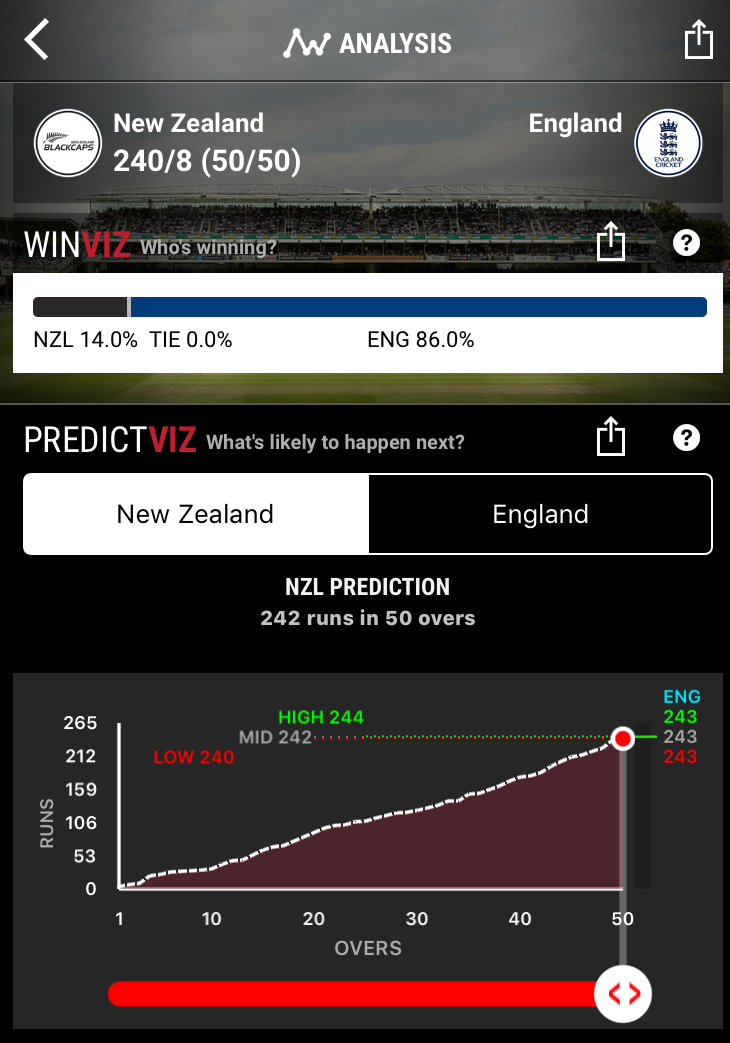
6. At the end of New Zealand’s innings, New Zealand amassed 241 runs. This is way short of England’s expected run total, which therefore leads them to maintaining an 86% win probability. (The following screenshot was taken during the final over when New Zealand had scored 240 runs).
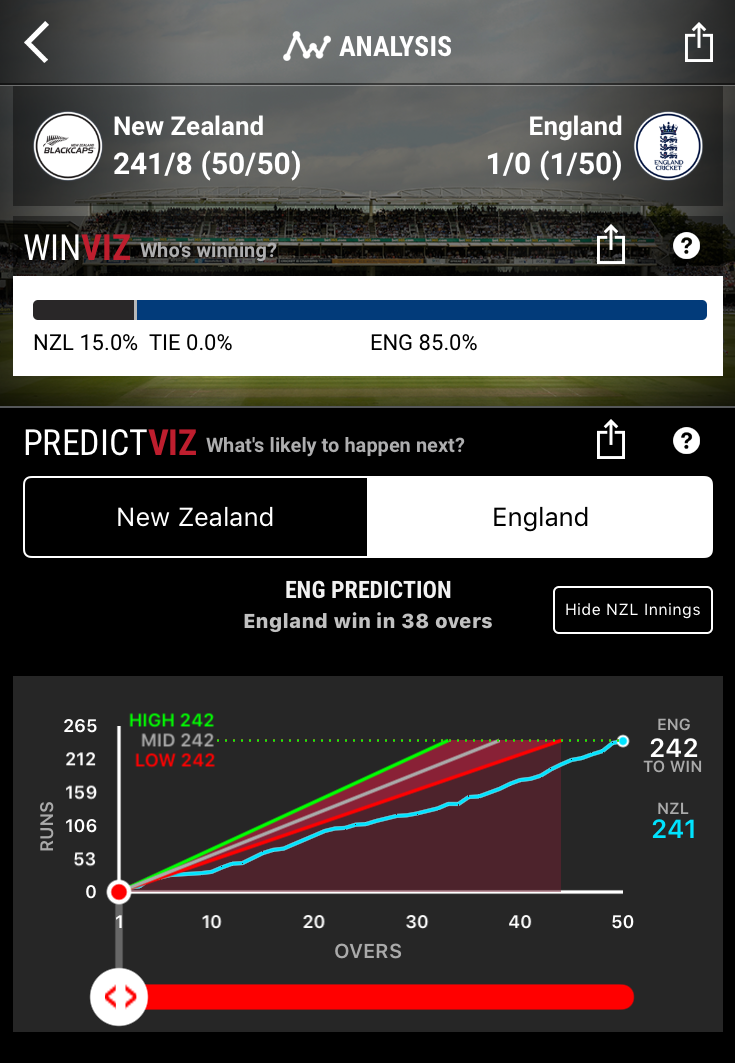
7. England make a slow start in the first over, scoring just a single run. Their win probability drops just very slightly.
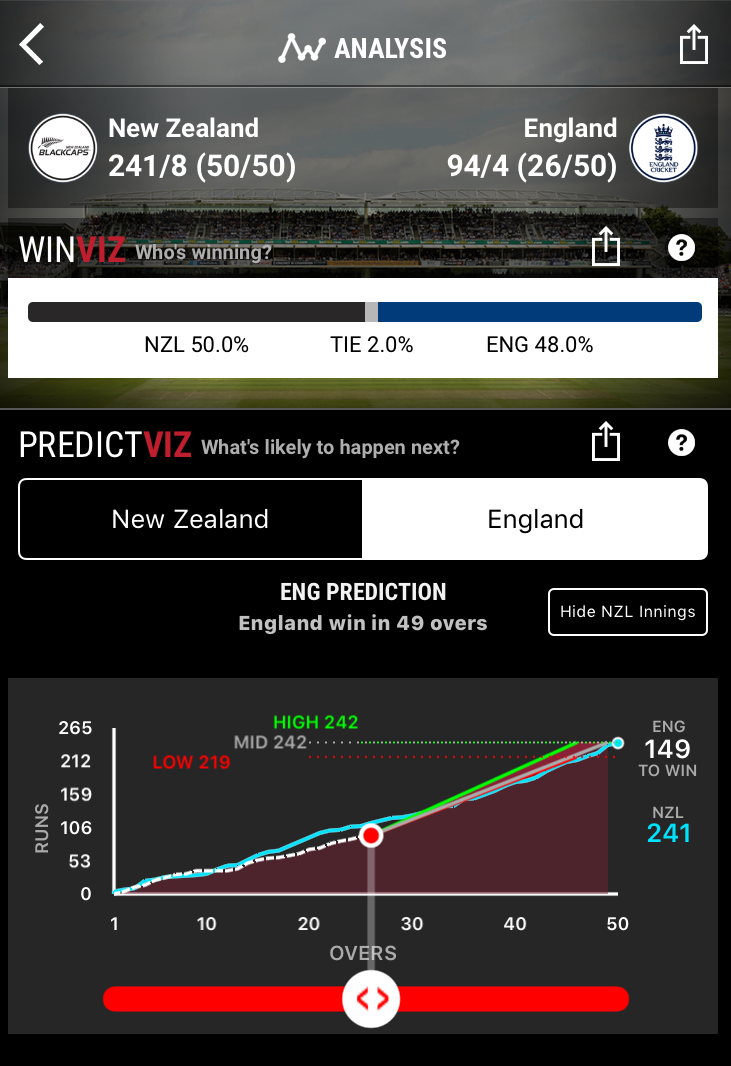
8. After 26 overs, England have had a mini-collapse, having scored just 94 runs – a lower figure than New Zealand made at the same point in their innings – while having lost 4 wickets. Their win probability drops dramatically to 48%.
9. A mini-recovery. On 41 overs England have increased their score to 168 – similar to New Zealand’s at the same point in their innings – without further loss of wickets. England’s win probability jumps back up to 66%.
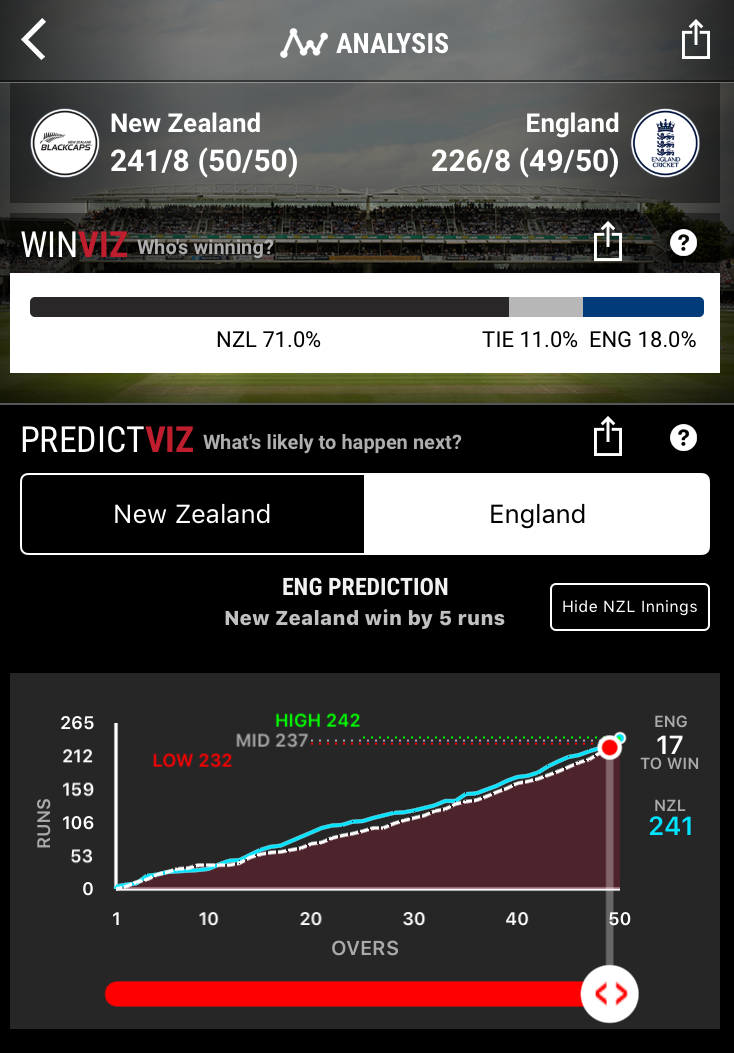
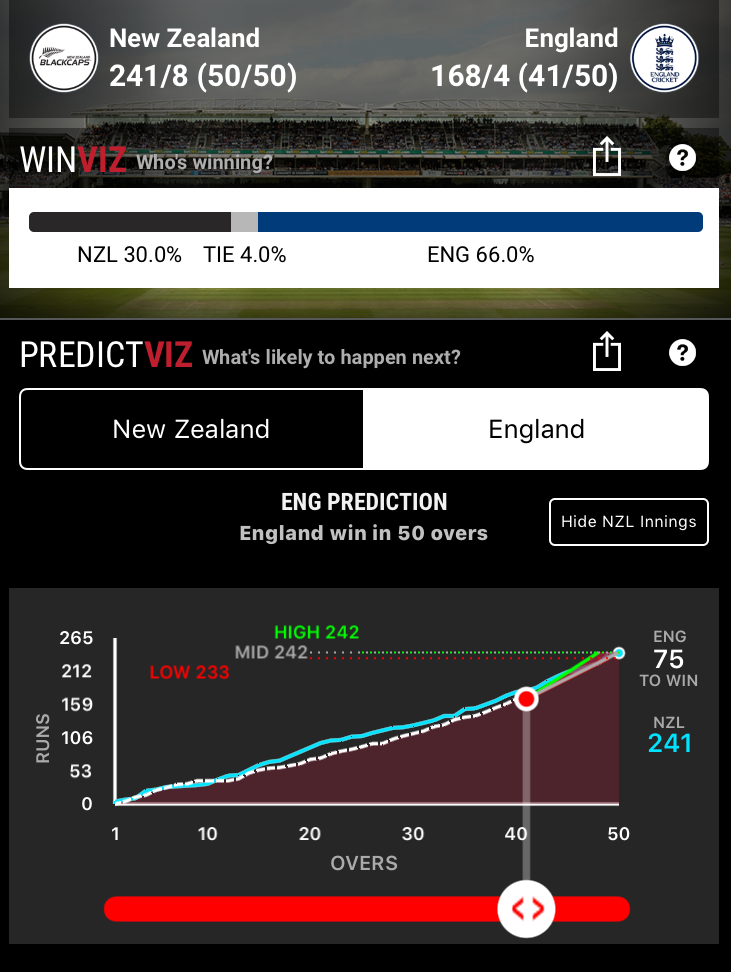 10. After 49 overs, England are in trouble. With just one over left, England are 15 runs behind with 2 wickets remaining. The model gives England just an 18% probability of winning outright, though the tie also has a fairly high probability of 11%.
11. The rest is history.
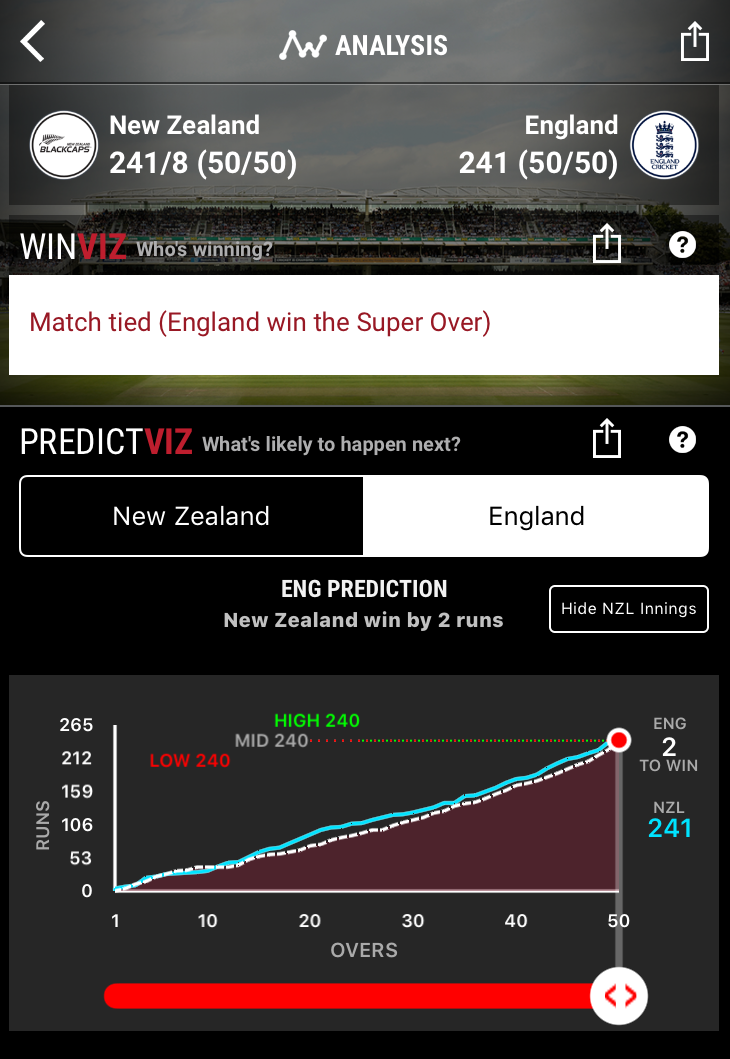
It’s obviously impossible to validate the precision of WinViz from a single game, but notwithstanding at least one bug in the graphics – England’s ‘to win’ target is incorrect throughout – the basic sanity check seems to be satisfactory for this match at least.
CricViz was developed by Nathan Leamon, who acts as a data analyst for the England team. An interesting article on his background and perspective on the use of data for supporting team development is available here. David Hastie, who used to work for our quant team, also played some part in the rollout of CricViz, and kindly provided me with additional background information to help with the writing of this post.
