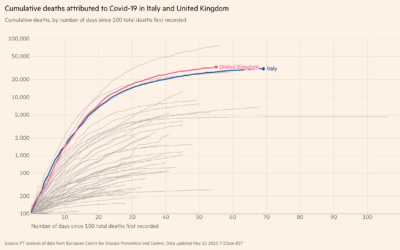
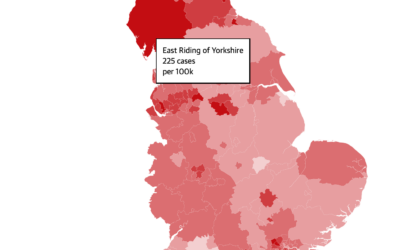
As of today there have been more than 90,000 confirmed deaths due to Coronavirus in the USA, despite But how important was the timing of the...
Latest News
Return to Blog
R: should you care?
There was a joke in my post last week where Binky the amateur epidemiologist was giving a lesson on the meaning of R. The joke is: we're all...
The politicisation of Statistics
My intention with these posts about Coronavirus has always been to show how Statistics can be used as part of a battery of scientific tools to learn...
Regional variations
A complication when looking at country-by-country numbers of Coronavirus cases or deaths is the effect of regional variations. Although China was...
Alert Level
This is a screenshot from the UK PM's statement to the nation regarding a roadmap towards ending the current Coronavirus lockdown. Taken literally...
Polite request to PM
Of course we should now use other countries to try and learn why our numbers are high David Spiegelhalter...
The best and the worst of Statistics
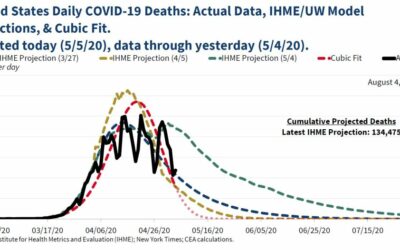
The above graph is included in the following tweet sent by CEA which is the Council of Economic Advisors to the US White House....
A cover up
As the focus moves from handling the initial wave of the epidemic to what life after a lockdown should look like, at least in the short term, one...
Target practice
Personally, I think both the setting of targets during this epidemic, and debates about whether targets are genuinely met or have been fudged, are...
Moving the goalposts
As you probably know, data on the state of the Coronavirus epidemic in the UK are presented and discussed at a daily press briefing. This...
Following the science
There's been a lot of discussion lately about the efficacy and efficiency of the UK government response to the Coronavirus epidemic. There are many...
Moving on
The UK, in common with all other countries that have managed to suppress the worst effects of the Coronavirus pandemic though strong social...


