As I’ve mentioned before, my aim in this blog is to raise awareness and understanding of statistical concepts and procedures, particularly with regard to potential applications in sports modelling. Often this will involved discussing particular techniques and methodologies. But sometimes it might involve simply referencing the way statistics has been used to address some particular important topic of the day.
With this latter point in mind, Channel 5 recently showed a program titled ‘Britain’s Favourite Crisps’ in which they revealed the results of a survey investigating, well, Britain’s favourite crisps. Now, if your cultural roots are not based in the UK, the complexities of crisp preference might seem as strange as the current wrangling over Brexit. But those of you who grew up in the UK are likely to be aware of the sensitivities of this issue. Crisp preferences, that is. Let’s not get started on Brexit.
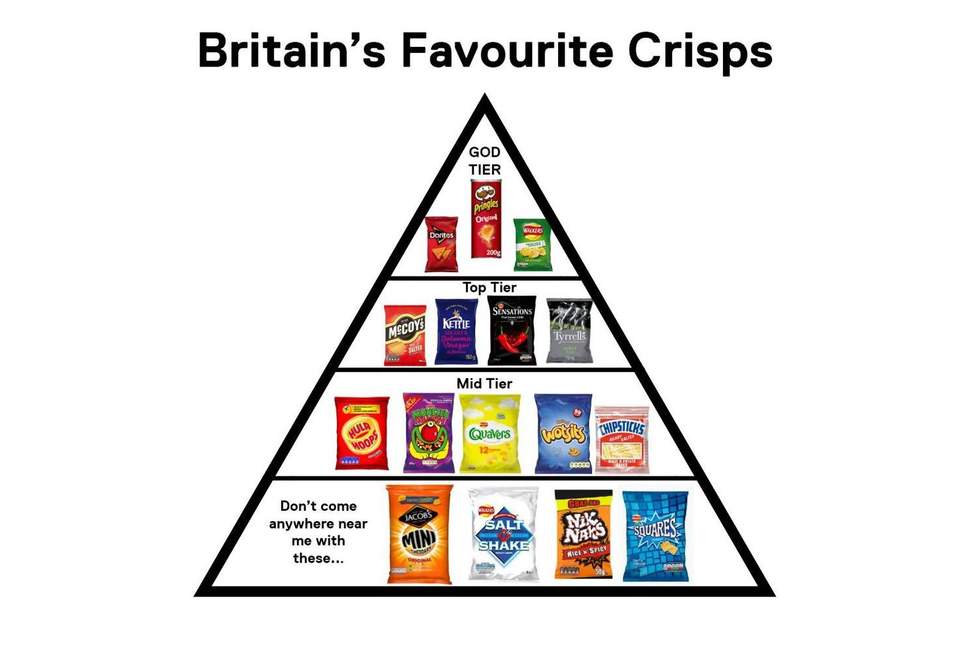
A summary of the results of the survey are contained in the following diagram:
And a complete ranking of the top 20 is included here.
As you might expect for such a contentious issue, the programme generated a lot of controversy. For example:
- Pyramid ranking of Britain’s favourite crisps sparks outrage
- Britain’s Favourite Crisps sends viewers into meltdown
- TV show revealing Britain’s favourite crisp sparks calls for second crunch vote
- Viewers furious at Channel 5’s ‘Britain’s Favourite Crisps’
- New best crisps ranking labelled ‘national scandal’ – people outraged by ‘top tier’
And so on.
Personally, I’m mildly upset – I won’t say outraged exactly – at Monster Munch appearing only in the Mid-Tier. But let me try to put my own biases aside and turn to some statistical issues. These results are based on some kind of statistical survey, but this raises a number of questions. For example:
- How many people were included in the survey?
- How were they interviewed? Telephone? Internet? Person-to-person?
- How were they selected? Completely randomly? Or balanced to reflect certain demographics? Something else?
- What were they asked? Just their favourite? Or a ranking of their top 20 say?
- Were participants given a list of crisps to choose from, or were they given complete freedom of choice?
- Is it fair to consider Walkers or Pringles as single categories, when they cover many different flavours, while other crisps, such as Quavers, have just a single variety?
- How were results calculated? Just straight averages based on sample results, or weighted to correct demographic imbalances in the survey sample?
- How was the issue of non-respondents handled?
- How certain can we be that the presented results are representative of the wider population?
- Is a triangle appropriate for representing the results? It suggests the items in each row are equivalent. Was that intended? If so, is it justified by the results?
It may be that some of these questions are answered in the programme itself. Unfortunately, living outside the UK, I can’t access the programme, but those of you based in the UK can, at least for some time, here. So, if you are able to watch it and get answers to any of the questions, please post them in the comments section. But my guess is that most of the questions will remain unanswered.
So, what’s the point? Well, statistical analyses of any type require careful design and analysis. Decisions have to be made about the design and execution of an experiment, and these are likely to influence the eventual results. Consequently, the analysis itself should also take into account the way the experiment was designed, and attempt to correct for potential imbalances. Moreover, a proper understanding of the results of a statistical analysis require detailed knowledge of all aspects of the analysis, from design to analysis.
And the message is, never take results of a statistical analysis on trust. Ask questions. Query the design. Ask where the data came from. Check the methodology. Challenge the results. Ask about accuracy. Question whether the results have been presented fairly.
Moreover, remember that Statistics is as much an art as a science. Both the choice of design of an experiment and the randomness in data mean that a different person carrying out the same analysis is likely to get different results.
And all of this is as true for sports modelling as it is for the ranking of Britain’s favourite crisps.
