You’ll remember Venn diagrams from school. They’re essentially a mathematical tool for laying out the information in partially overlapping sets. And in statistics they are often used in the same way for showing the possible outcomes in events which might overlap.
For example, here’s a Venn diagram showing the relationship between whales and fish:
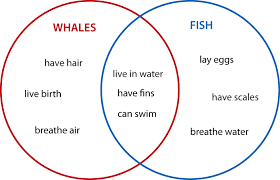
Whales and fish have some properties that are unique, but they also have some features in common. These are all shown in the appropriate parts of the diagram, with the common elements falling in the part of the sets that overlap – the so-called intersection.
With this in mind, I recently came across the following Venn poem titled ‘At the Intersection’ written by Brian Bilston:
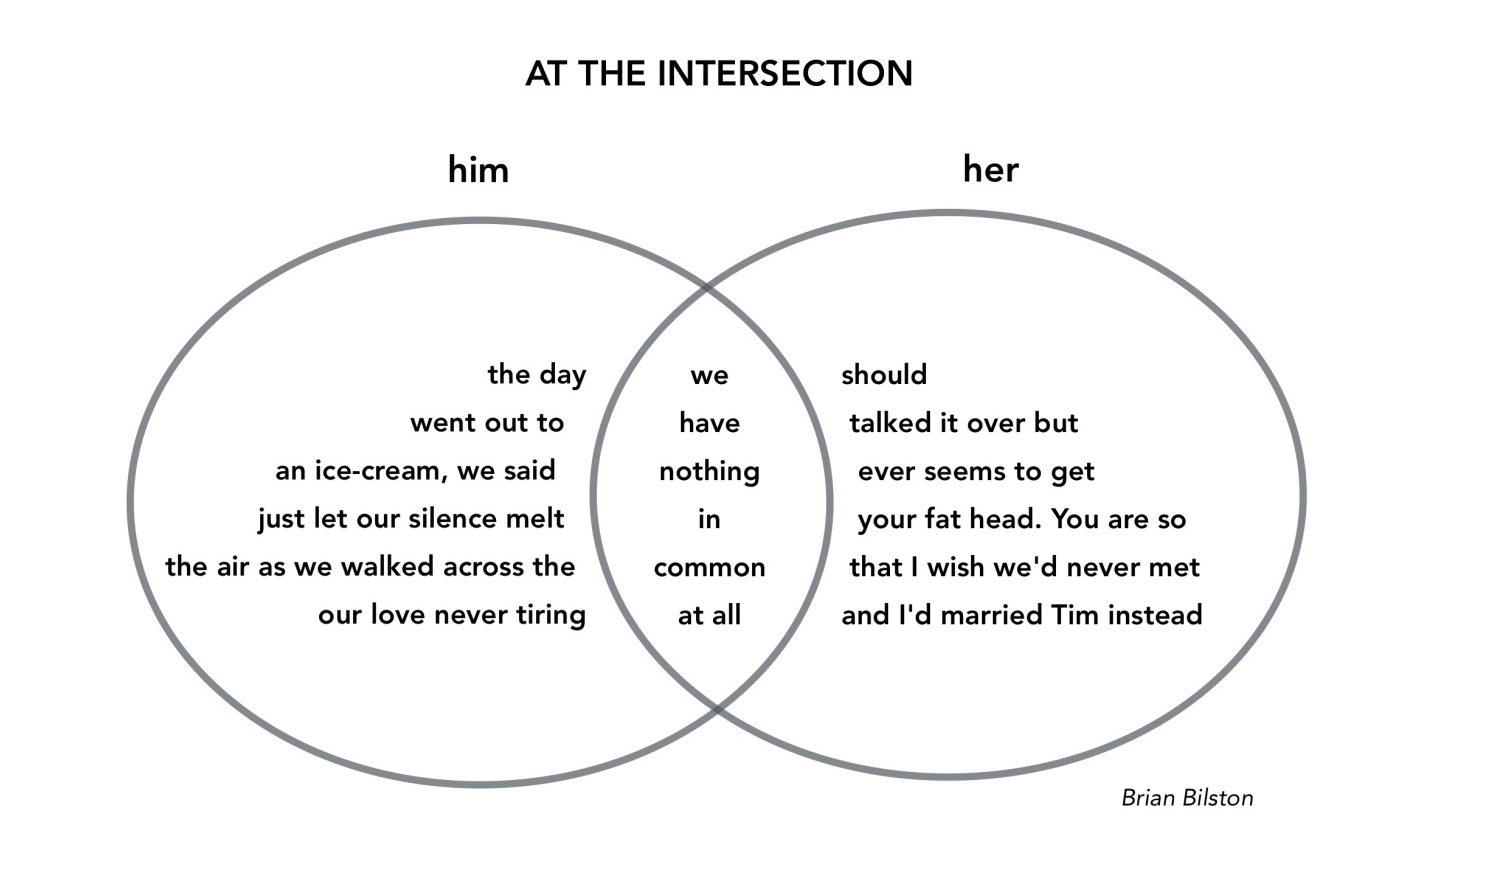
You can probably work it out. There are three poems in total: separate ones for ‘him’ and ‘her’ and their intersection. Life seen from two different perspectives, the result of which is contained in the intersection.
Genius.
