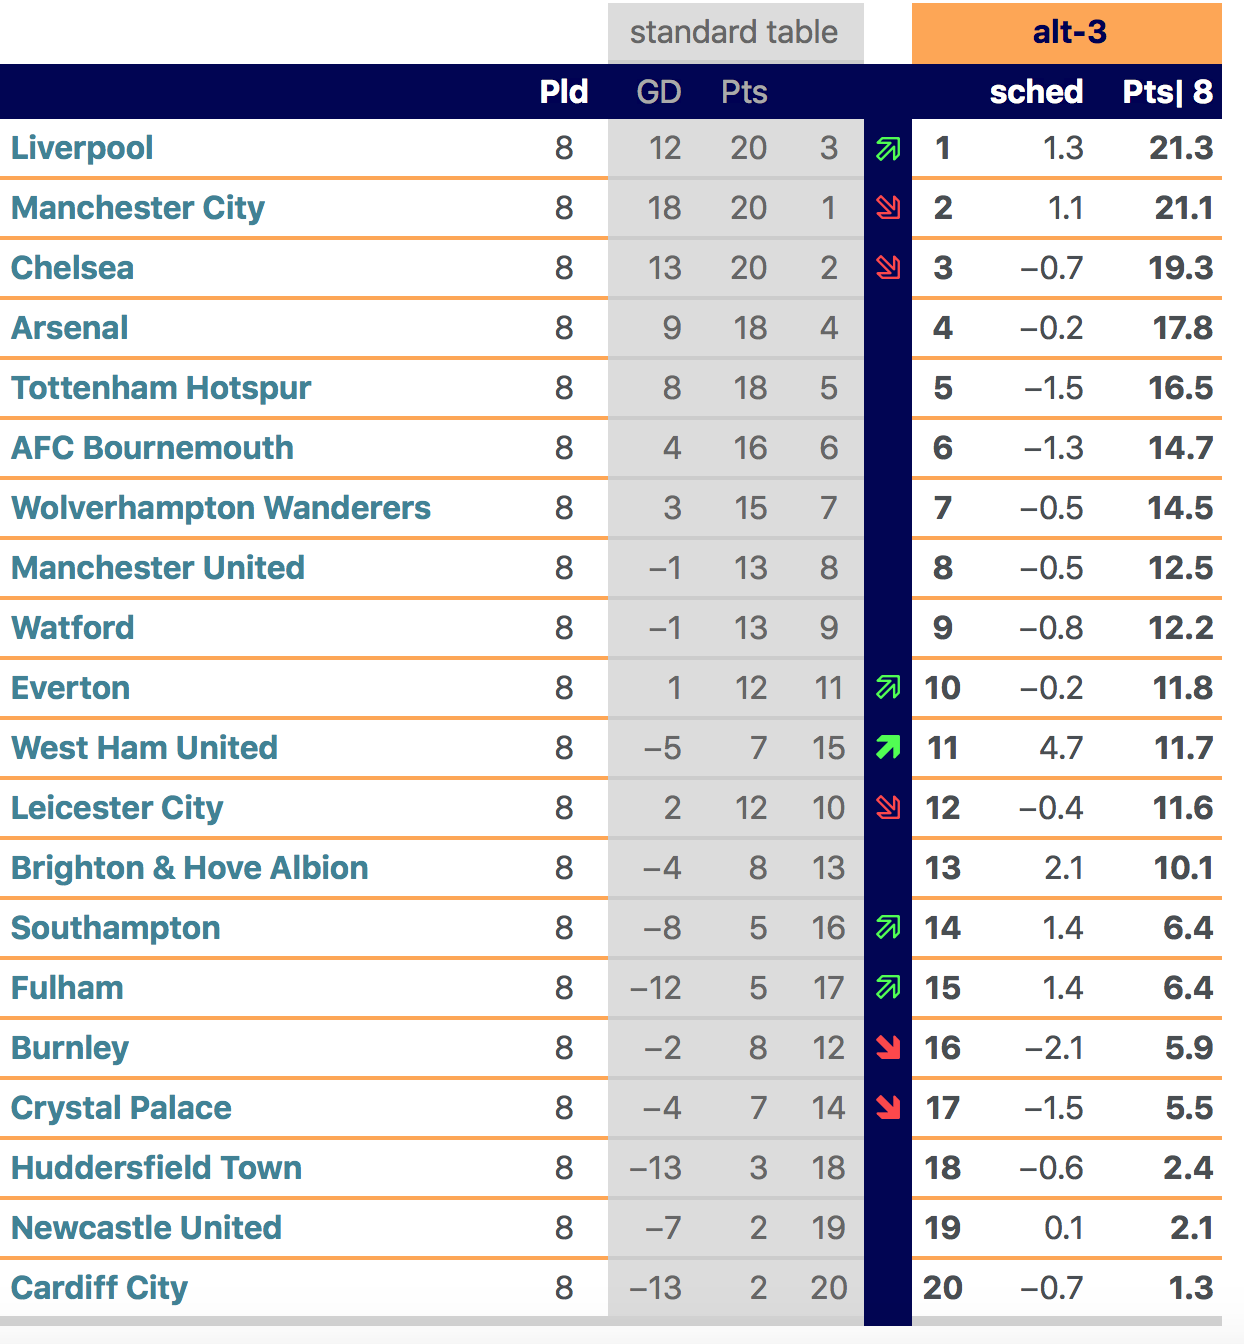
Ever wondered what league tables would look like if each team’s overall performance was measured not just by their total points scored, but also by the quality of the opposition they had faced? Well, wonder no more. David Firth and colleagues at Warwick University produce a weekly table that does precisely that. Here’s the table for the English Premier League after 8 rounds of games (8 October).

The left hand side of the figure shows the true table; the right hand side shows an adjusted table with a corrected number of points (and therefore position) for each team based on the quality of the opposition they have already faced. The adjusted points per team, listed in the table here as Pts|8, is the actual points from the true table, plus the value of shed, which takes a large positive value of teams have faced tough opposition so far, but is large and negative for teams that have played relatively weak opposition. The green and red arrows show teams who’ve gone up or down respectively when using the alternative method of calculating points.
Some headline conclusions based on the current table are:
- Liverpool piggyback to top in this scheme of things, since the model evaluates that their initial set of fixtures has been more arduous than those of either Man City or Chelsea;
- West Ham have the biggest shed value of 4.7, implying they have had the hardest set of fixtures so far among all the Premier League teams. Once this value is added to their actual points, their position changes from 15th to 11th.
- Burnley and Crystal Palace have positions in the true league that flatter to deceive. They’ve had relatively easy fixtures compared to other teams, and accounting for this factor means they drop by 4 and 3 places respectively.
It’s not exactly rocket science, but the mathematics required to calculate the adjusted tables is fairly sophisticated compared with the simple arithmetic that leads to the standard tables. If you’re interested there’s a summary here. Though different, our own models for football and other sports are built on similar principles, so that team ratings are affected not just by previous results, but also by the quality of the opposition those results were achieved against. Future posts might discuss this in further detail.
As well as providing weekly tables, Alt-3 also provide a blog which discusses the results and highlight the differences between the standard and the revised tables.
