(William Shakespeare, The Merchant of Venice, Act II Scene 7)
IBM has teamed up with Wimbledon for a number of years to drive the use of data-based technology as a way of increasing the tournament’s accessibility and popularity. Their novel addition this year was the inclusion of an Artificial Intelligence system to provide match winner predictions – in the form of win probabilities – for each of the matches. These probabilities were then fed directly into the Wimbledon app. As IBM put it:
During this year’s Wimbledon Championships, tennis fans around the world will be able to experience AI-generated content across the Wimbledon digital platforms, enabling fans to dive deeper into the contextual understanding behind tennis players and their upcoming matches.
And here’s what IBM say specifically about the procedure of providing match predictions using an AI algorithm that they call ‘Watson’. This is in a section titled ‘Trustworthy tennis predictions‘:
Each ladies’ and gentlemen’s upcoming head-to-head match are provided on the digital platforms with a predicted outcome. If the players have played previously, a predictive model with 19 semi-independent variables provides a prediction. The variables include each player’s Power Index value, surface performance, ratio of games won, age, quality of recent wins, and media sentiment. Players who have never played against each other use a predictive model with 14 semi-independent variables. The probabilities of winning takes into account uncertainty quantification to increase match prediction accuracy levels. Each of the win probabilities is visualized through a doughnut plot with Wimbledon branded colors.
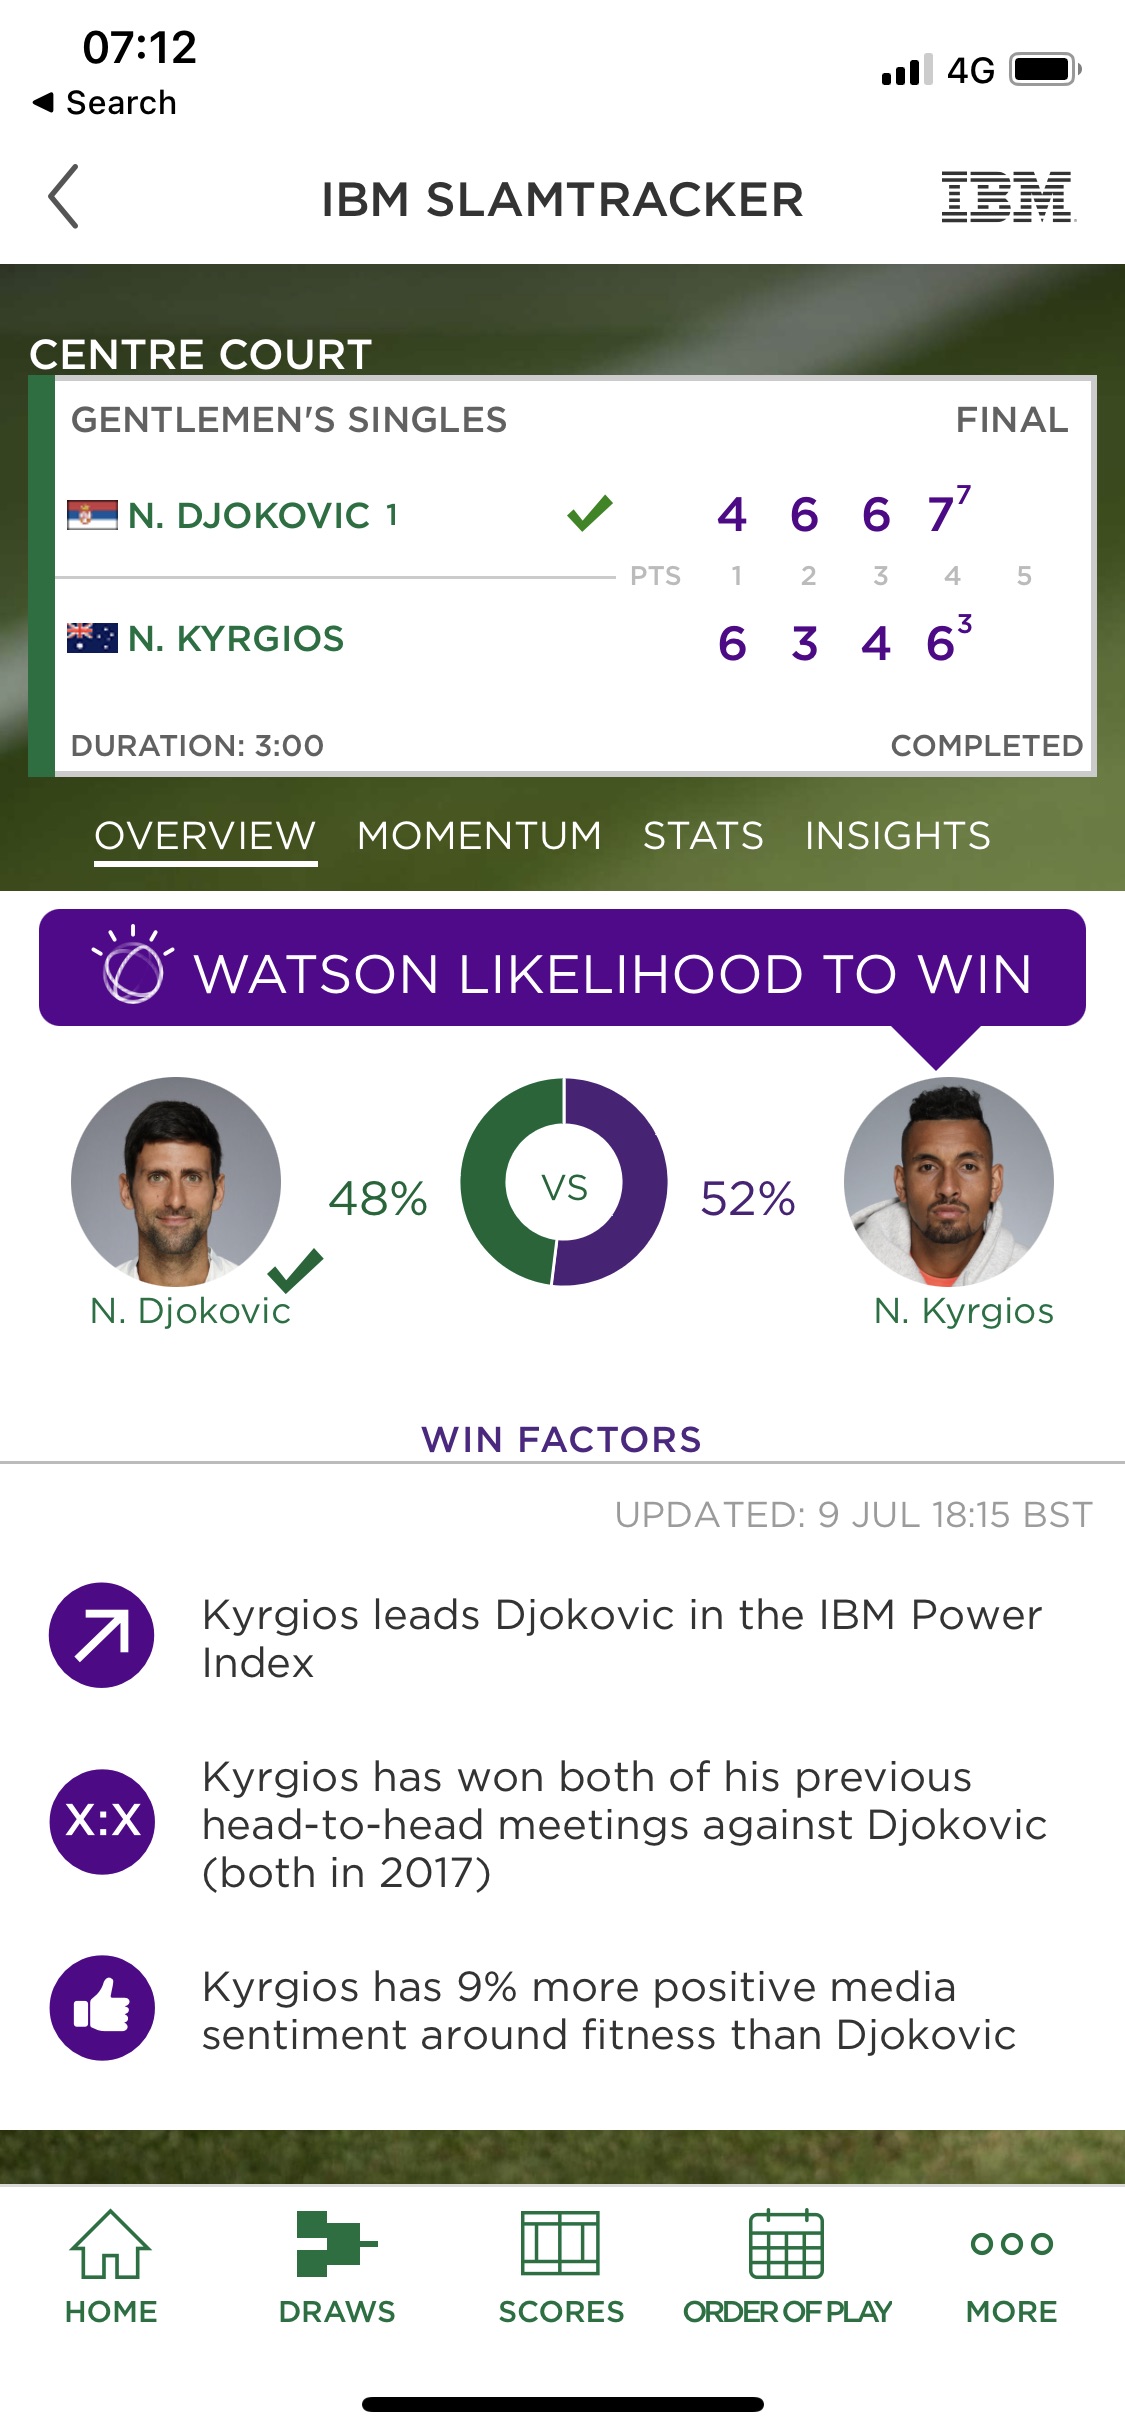
Here’s an example of the iPhone app interface:

This is a screenshot taken from the Wimbledon app in respect of the Djokovich-Kyrgios men’s singles final. Since the screenshot shows the final scores, it was taken after the match finished, but the thing of interest – the so-called “Watson likelihood to win” – refers to the IBM win probabilities calculated before the match started. So, in this case, Watson called it as a virtually 50/50 match, with Kyrgios just edging it at 52% to win. As an aside, you can see that the app also shows a number of ‘Win Factors’ – these are several of the pieces of information which are used internally in Watson to calculate the win probability.
For good measure, the IBM description page also provides the following diagram to illustrate the “tennis player prediction architecture”:
That’s a lot of glitter, but is it gold?
There’s a large overlap between Artificial Intelligence and Statistics in settings such as this. In both disciplines the objective is to exploit available historical data to estimate optimal win probabilities for upcoming games. The underlying models are also not so very different. The main difference is that AI algorithms usually cope better when there are a large number of variables entering the model, potentially with complex interactions amongst them. For example, player age might be an important factor, but its role could depend on the surface, the weather conditions and many other factors, each of whose effects depend in turn on other variables, whose effects may themselves also depend on player age. AI algorithms are designed to capture complex relationships like these and to exploit them when providing predictions.
One price to pay with AI models compared to statistical models is that they are often difficult to interpret – for example, player age might interact with so many other variables, which themselves interact with others, that it isn’t clear what the overall impact of player age is. You simply have to throw all the numbers in and get the prediction out, without any broader interpretability of how the model is using the various pieces of data. Statistical models, being generally simpler, often provide an easier interpretation. Another risk with AI models is that they are driven too much by noise – they explain very well the historical data to which they were fitted, but do so by moving to the noise, which they wrongly identified as signal. However, in the right hands, AI models are extremely powerful, often outperforming the equivalent statistical models. And you’d guess that an IBM/Wimbledon combination would be the right hands for tennis predictions. But let’s look at the evidence.
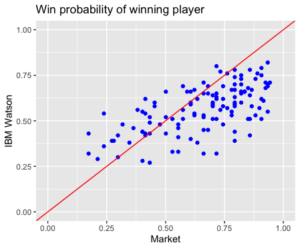
I extracted each of the IBM match predictions for the men’s single tournament and compared them against the market prices. To be more precise, I took the pre-match odds from Bet365 and converted these into implied win probabilities, having first adjusted for the fact that bookmakers have an in-built profit margin in their prices. The graph below compares the IBM Watson win probability for the eventual match winner in each of the matches against the same quantity based on the market prices.

There’s a general tendency for the market and IBM Watson probabilities to increase together, which implies both the market and Watson are reacting to the same information. But there’s also a large amount of variation, while if the two sets of probabilities were in close agreement, all points would be near the diagonal red line. This implies that the Watson probabilities are not replicating particularly well the market prices. But this needn’t be a bad thing – maybe Watson is doing better than the market (with its 19 semi-independent variables etc) and could actually be used to bet profitably against the market?
It’s unlikely…
Recall that what’s shown in this plot are the market and Watson probabilities assigned to the player who actually turned out to win each particular game. Points above the red line in this diagram are where Watson gave a higher probability to the actual winner than the market; those below the line are where the market gave a higher probability. And you can see that there are many more points below the diagonal than above. In other words, there are many more matches where the market gave a higher chance of winning to the eventual winner than Watson did. That’s to say, many more matches where the winner was better predicted by the market than Watson. Moreover, the distance below the diagonal is very large in some cases. So not only in Watson giving generally poorer predictions than the market, but they are much poorer in many cases.
Though there are better ways statistically of summarising the difference between Watson and the market, one simple comparison is obtained by calculating the average probability assigned to the winning player for each prediction method. For Watson it’s 0.56 or 56%; for the market it’s 0.66 or 66%. So, on average, Watson gave a 56% probability to the winning player; for the market it was 66%. This is a big difference, both in statistical and practical terms: Watson is terrible relative to the market, with probabilities that, in absolute terms, are 10% worse on average.
We can also look at things another way. What would have happened if I had used the predictions from Watson to bet on the market? In each match I’ll use the Watson probabilities to decide on which, if either, of the two players to make a bet and then calculate my winnings or losses on the basis of who actually won and what the market price was. For example, in the Djokavic-Kyrgios final, the market odds for a Djokavic or Kyrgios win were 1.28 and 3.75 respectively. As we saw above, Watson made Kyrgios the slight favourite with a 52% win probability. So, according to this prediction, my expected profit from a unit-stake bet on Djokavic would have been
(0.48 x 0.28) + (0.52 x (-1)) = -0.39
By contrast, a unit-stake bet on Kyrgios would have yielded an expected profit of
(0.52 x 2.75) + (0.48 x (-1)) = 0.95
Then since we’re looking to maximise expected profit, Watson’s decision for this match would have been to bet on Kyrgios which, since Djokavic won, would have resulted in a loss of the unit stake. Had Kyrgios won, the model would have led to a profit of 2.75 units (the price minus the stake).
Occasionally, if the model probability is very close to the market probability, the expected profit for a bet on either player will be negative. This is due to the profit margin bookmakers build in when setting prices, and in such cases the correct decision is to not place a bet.
Applying this procedure with Watson’s numbers to the complete set of 125 matches available – first round to final, but with the walkovers excluded – I’d have placed bets on 111 matches. I’d have won in 29 of those matches, yielding a total profit of 48.12 units based on a unit bet-per-match stake. But I’d have lost my stake in the remaining 82 matches. So Watson’s overall performance is a total loss of 33.9 units, which corresponds to a -0.31 unit stake loss per bet. Again, this amounts to a terrible performance, even allowing for the small sample size.
If we make things a bit fairer for Watson by removing the in-built bookmaker profit and adjusting numbers to give fair odds, we’d have bet on every game and lost a total of 30.2 units, corresponding to an average loss of 0.24 units per bet. Naturally, a bit better, but still a very significant loss.
So, plenty of glitter, but no gold.
In other words, beware the AI hype. It’s not that AI methods are always poorer than statistical methods, but predictions from AI methods should be subject to the same level of scrutiny as those from statistical analyses. And in this case, despite the pretty pictures, the fancy language and the prestigious history of the developers of the Watson platform, the model itself is plainly faulty. And I’d bet on the chances of a standard simple statistical model doing very much better in this example.

