A few posts back I tried to explain the concept of herd immunity, since that seemed to be a cornerstone of the UK policy to handle the Coronavirus epidemic. Now, just a short time later, that approach seems to be off the table, and the UK is catching up with other European countries in applying measures that restrict social contact and therefore limit the rate of transmission of the virus. The previous post also described – loosely – how if an infected person passes the virus to an average of less than one other person, then the epidemic will fade out; otherwise it will grow exponentially.
So, what forced the change in government policy? Actually, not very much – the basic scientific modelling had been around for some time. But evidence from Italy suggested that demand for ICU support in hospitals for infected individuals – both in terms of number of patients, and length of treatment – would be greater than originally assumed. And the effect of this recalibration meant that the NHS capacity for ICU would have been woefully inadequate without some kind of intervention.
The change is strategy was based on work carried out at Imperial College and summarised in this report. As academic papers go it’s fairly readable, but I thought it might still be useful to give a brief summary here. So, I’ll give an outline of the methodology used, and then a picture-trail of the main conclusions.
The techniques used can be summarised as follows:
- A standard model for transmission of flu-type epidemics was adopted. This basically assumes that anyone having the disease has a probability of passing the disease on to anyone they have contact with. So the rate of transmission depends on the probability of transmission and the average number of contacts a person has. (See this post for discussion on these types of models.)
- The parameters for this model – things like the transmission rate of the disease – were estimated using data from China and Italy, where the current epidemic already has a longer history;
- The model also requires country-specific demographic information extracted from the population census, so that the numbers of infections within households, between work colleagues and so on, can be reasonably predicted.
- Simulations from the model were generated under alternative strategies for population restriction, leading to probability estimates of the number of infections and fatalities under each strategy.
Two broad types of strategy were considered:
- Mitigation strategies, in which the average transmission rate is reduced, but stays greater than 1. In this case there is exponential growth of the epidemic until the herd immunity effect kicks in and the epidemic dies out.
- Suppression strategies, in which the average transmission rate is reduced to a level below 1, so that the exponential growth phase of the epidemic is shortened considerably.
And here’s the picture-trail giving the conclusions (for the UK):
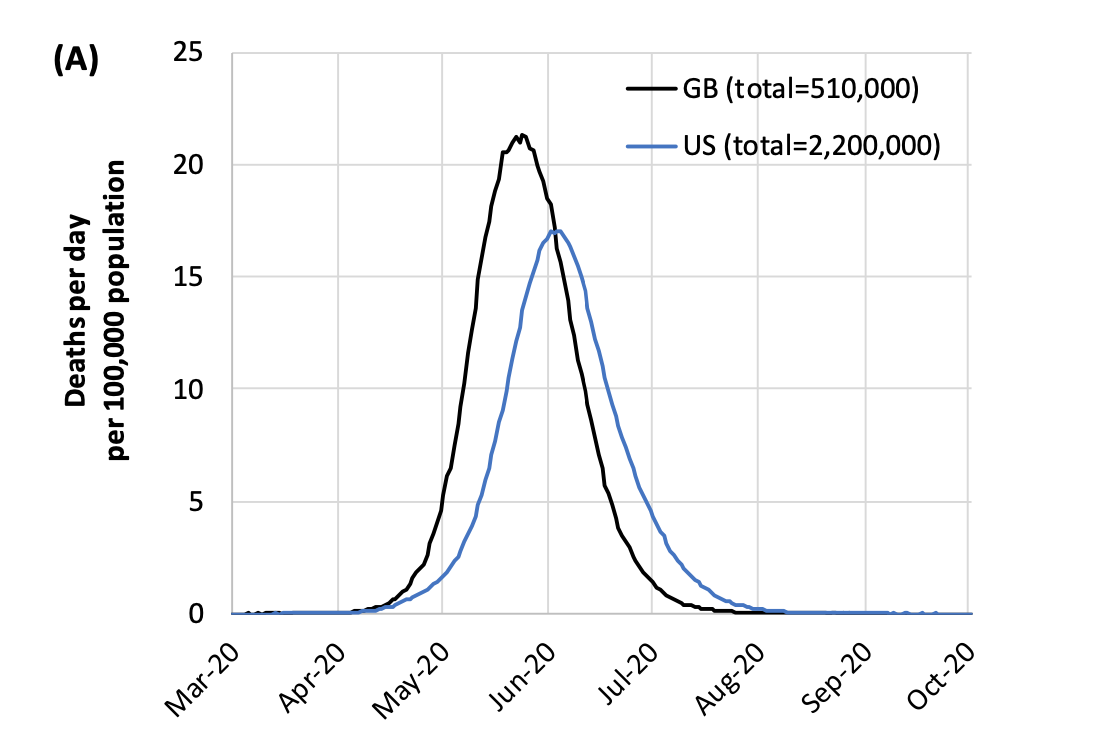
Picture 1:
Based on the input demographics and the estimated transmission rates, this graph shows the expected number of daily fatalities – both for the UK and US – if no population restrictions were applied. For the UK the peak number of fatalities per day would occur towards the end of May, with around half a million fatalities in total. This is a large number of fatalities, but the epidemic would be effectively over by July, at which point the acquired immunity in the population as a whole would prevent further epidemic outbreak.

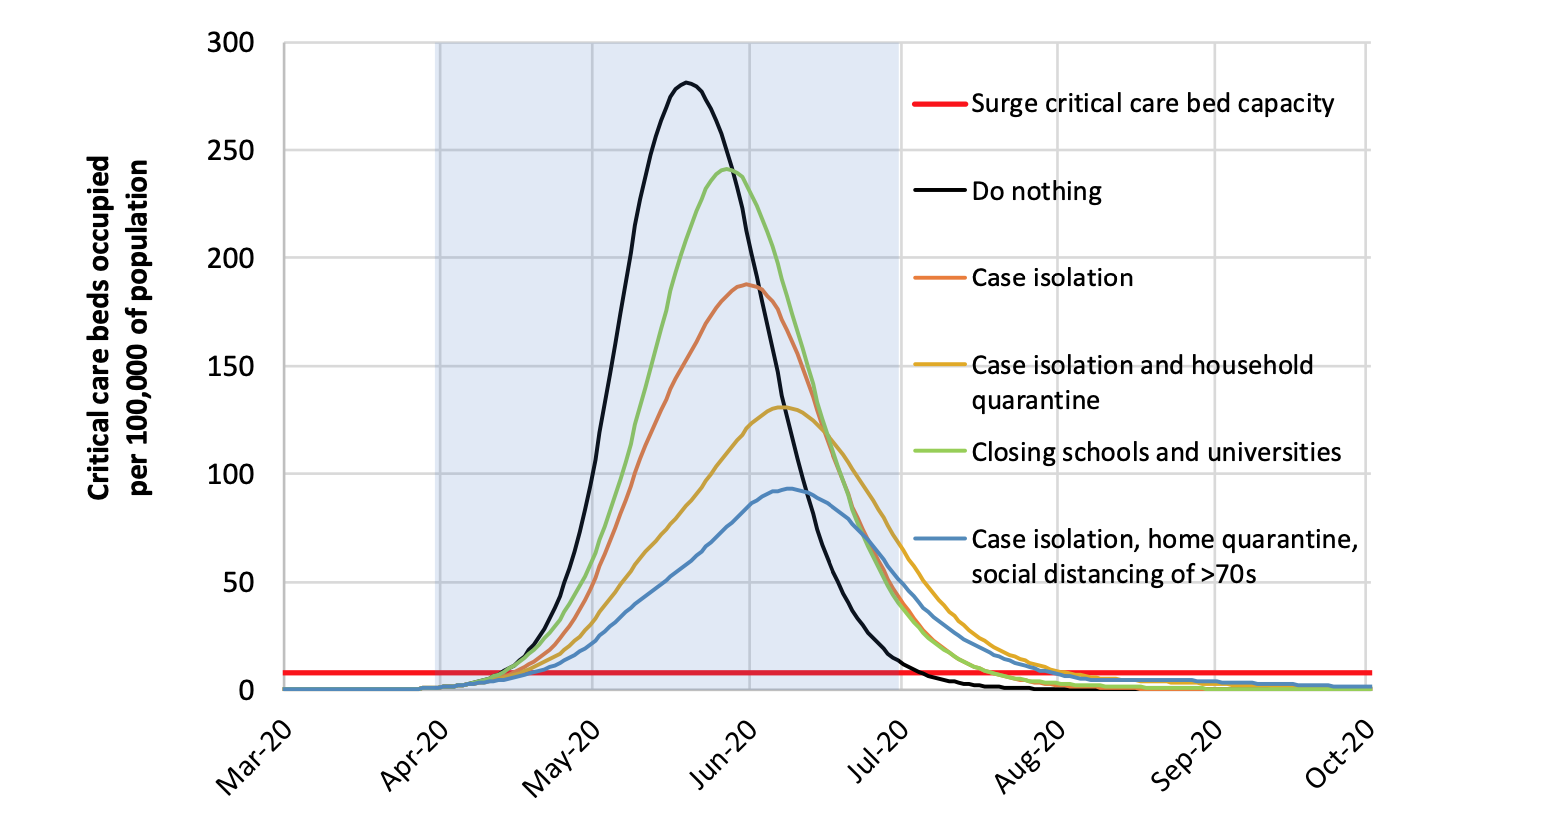
Picture 2:
This graph shows the effect on ICU beds of various forms of mitigation strategy, ranging from school closures only (green) to isolating cases, quarantining affected households and social-distancing of over-70’s (blue). Also shown again, for comparison, is the ‘do nothing’ curve (black). The red line is current capacity for ICU beds, while the shaded light blue area is the time period over which it is assumed the restriction measures are in place. So, just as with a ‘do nothing’ policy, each of these strategies leads to the epidemic being extinguished due to the herd immunity effect, albeit a few weeks later towards the end of July. And each of the strategies does reduce the peak demand on ICU facilities. But, even the most stringent of these strategies leads to a demand on ICU beds that is still around 12 times current capacity. This is considered unsustainable.

Picture 3:
This graph considers suppression strategies. Again, the demand on ICU beds is plotted through time, assuming a suppression strategy is adopted for the time window shaded in blue. The second panel is just a zoomed-in section of the first graph, focusing on the lower part of the graph. Both suppression strategies offer a massive improvement over doing nothing (again shown in black) up until July. The version which includes school closures as well as social distancing is actually predicted to keep ICU demand well below capacity right through to October, while a loser version without school closures leads to a 50% shortfall in resources, which I imagine to be manageable.
So in the short term these suppression approaches are far superior to mitigation in keeping ICU demand below reasonable levels. The problem, as you see from the graph, is that once the restrictions are removed, the epidemic starts all over again in the autumn. Indeed, the most stringent approach, including school closures, leads to demand in the winter of 20/21 that is higher than what the ‘do nothing’ strategy would have led to in the summer of 2020.


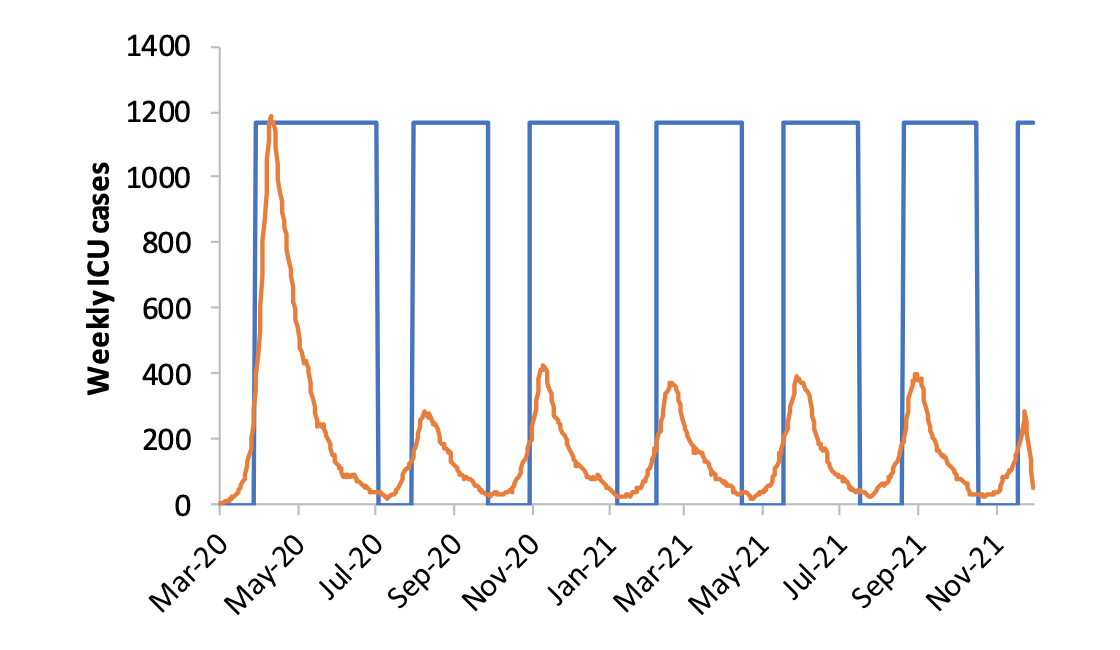
Picture 4:
To get round the problem of the epidemic re-starting, the report looks at various strategies of containment based on the idea of relaxing restrictions when pressure on ICU units is low, and then placing them back when numbers grow back to a specified level. In this picture, the blue rectangles correspond to periods where restrictions are applied. In each such period, after a short period of further growth, the epidemic is controlled and brought back down to very low-levels. Then the restrictions are relaxed again, and the pattern repeats itself. In this way, some semblance of normal life is maintained by having periods with no restrictions, while the level of the epidemic is always contained by having periods with restrictions. As you can see in this final picture though, it’s estimated that the periods with restrictions would need to be about twice as long as those without.

So, there are no easy solutions.
- Mitigation would allow the epidemic to run its course and fade in the space of just a few months. But it would lead to very many fatalities, and unsustainable pressures on the NHS;
- Suppression through social distancing, quarantining and school closures will reduce short-term fatalities and ease pressure on health services, but does little to alter the long-term trajectory of the epidemic;
- On-off versions of suppression can be used to contain the epidemic to sustainable levels, but will require long periods of restrictions, well into 2021 at least.
Of course, none of this is especially cheerful, but it’s obviously important to know the science when planning. It seems that the UK government’s original approach was a version of mitigation, until the recalibrated version of the model used in the Imperial College report set out what the short-term consequences of that would imply. So, like most other Europeans countries, the government moved to the current – and still evolving – suppression strategy based on social distancing, quarantining and school closures. Exactly as unfolded in Italy, it became imperative to control the first wave of the epidemic; concerns about potential future waves will have to be addressed, but by then more will be understood about the spread of the epidemic.
There are, moreover, a number of issues which may make the picture less gloomy than it seems.
- Though the report has used the very best expert opinion available when building models and estimating unknowns, it’s possible that things are better than the model assumes;
- A big unknown is the number of asymptomatic carriers in the population. If there are many people who have the virus without realising it – and there is some evidence to suggest that’s the case – then the natural build-up to a ‘herd immunity’ effect may be much more advanced than the model assumes, and the epidemic may die out quickly after a first wave, even with a suppression-based restrictions;
- It may be that the virus is more strongly seasonal than the model assumes, and that summer in the northern hemisphere causes a slowdown of the virus;
- Trials for vaccines are already underway. If a successful vaccine can be brought developed quickly and distributed, it may also eliminate the need for further rounds of restrictions;
- Tests that can assess whether someone has previously had the virus are also under development. At the moment, social distancing is required of all individuals. But there may be many people who have had the virus without realising and who are now immune. Identifying such individuals through testing would enable them to return safely to work.
- There are promising signs that certain existing anti-viral treatments, perhaps used in combination, will prove to be an effective cure to the Coronavirus disease, at least for some groups of critically ill patients.
In summary: the statistically-based Imperial College analysis shows how the government can implement social-interaction strategies to keep fatalities and pressure on health service facilities to tolerable levels. The time bought by these strategies – admittedly at a large economic and social cost – can then be used to enable other sciences to develop tests and vaccines to stem the epidemic entirely. It’s a battle, but understanding the statistics and adhering to the strategies adopted are key to winning it.
The Imperial College report contains considerably more detail than I’ve included here.
Other summaries of the report can be found here and here. Thanks to Mike for pointing me to the second of those.
